


USD/MXN (USDMXN) Is down 0.51% on Oct 6: What Is Behind the Currency Move?
USD/MXN (USDMXN) is down 0.51% at Oct 6 07:30(ET), now at $17.97953, with a 7-day down of 0.35%.
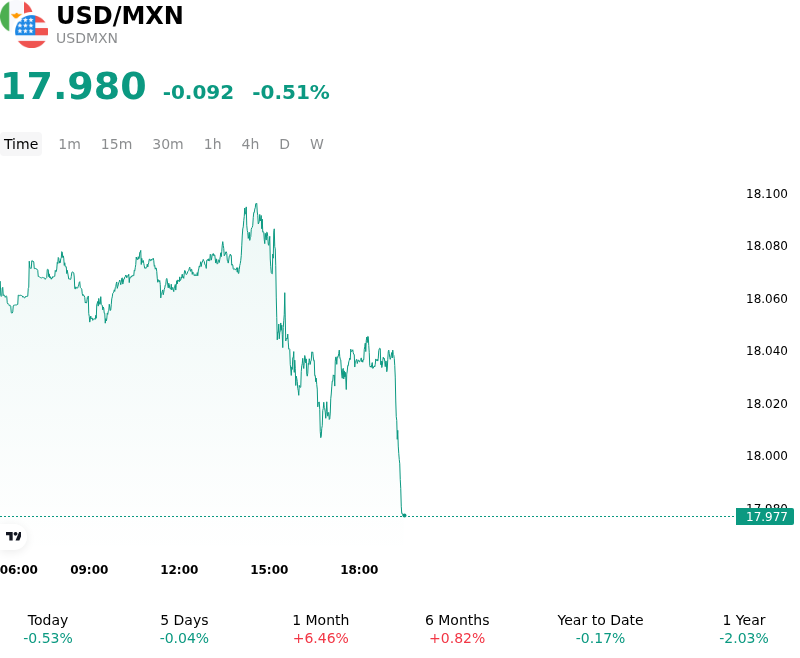
What is driving USD/MXN (USDMXN)’s stock price down today?
The downside pressure on USDMXN during the session was predominantly driven by a retreat in the U.S. dollar, as softer macroeconomic indicators tempered market expectations for persistent Federal Reserve policy tightening. Moderation in U.S. business activity and labor market momentum prompted investors to scale back near-term rate projections, placing a ceiling on U.S. Treasury yields. As rate expectations cooled, broad dollar demand ebbed across foreign exchange markets, triggering long-dollar position unwinding and allowing high-beta Latin American currencies to advance.
On the Mexican peso side, the currency benefited from its compelling carry-trade appeal and strong interest-rate differential cushion. Banco de México's elevated policy benchmark rate continues to offer institutional investors an attractive yield premium over U.S. fixed-income assets. Additionally, resilient domestic economic indicators reinforced market confidence that local economic fundamentals remain supportive ahead of upcoming Mexican inflation data releases and central bank minutes.
A general stabilization in global risk sentiment also encouraged capital flows into emerging market assets, accelerating the downward momentum in USDMXN. Technical profit-taking contributed to the move as traders adjusted exposure following the pair's recent test of upper resistance levels. Over the medium term, FX strategy desks continue to monitor the relative policy trajectory between the Federal Reserve and Banxico, with the rate spread remaining the primary anchor for the pair's directional bias.
Technical Analysis of USD/MXN (USDMXN)
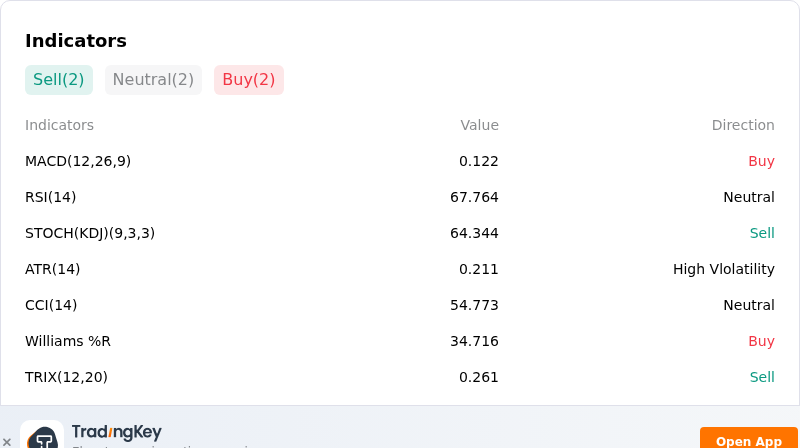
Technically, USD/MXN (USDMXN) shows a MACD (12,26,9) value of 0.122, indicating a buy signal. The RSI at 67.764 suggests neutral condition and the Williams %R at 34.716 suggests buy condition. Please monitor closely.
More details about USD/MXN (USDMXN)
Recent Events and Risks:
- EM FX Carry Trade Liquidation: Heightened volatility in US interest rate markets and elevated US Treasury yields have triggered a sharp unwinding of crowded long-peso carry trades, with leveraged fund position squeezes driving intraday volatility and upward pressure on USD/MXN.
- Banxico-Fed Yield Spread Compression: Banco de México's policy decoupling from the Federal Reserve and steady benchmark rate stance, alongside persistent US inflation metrics such as the ISM services prices paid index rising to 74, continue to erode the US-Mexico interest rate differential and diminish the peso's risk-adjusted carry buffer.
- Fiscal Consolidation and USMCA Negotiation Risks: Government budget projections pushing Mexico's public debt toward 55% of GDP by 2027, paired with IMF warnings regarding fiscal consolidation and recent delays in USMCA review negotiations, have introduced a Mexico-specific risk premium that destabilizes currency sentiment.
- Event Risk from Upcoming Inflation and Banxico Minutes: Near-term intraday volatility risks remain elevated ahead of imminent Mexican consumer and producer price index releases and Banxico meeting minutes, where dovish central bank signals could trigger fresh peso selling around key technical resistance levels.
Recommended Articles


