


WTI (USOIL) Is down 2.22% on Oct 6: Key Drivers to Watch
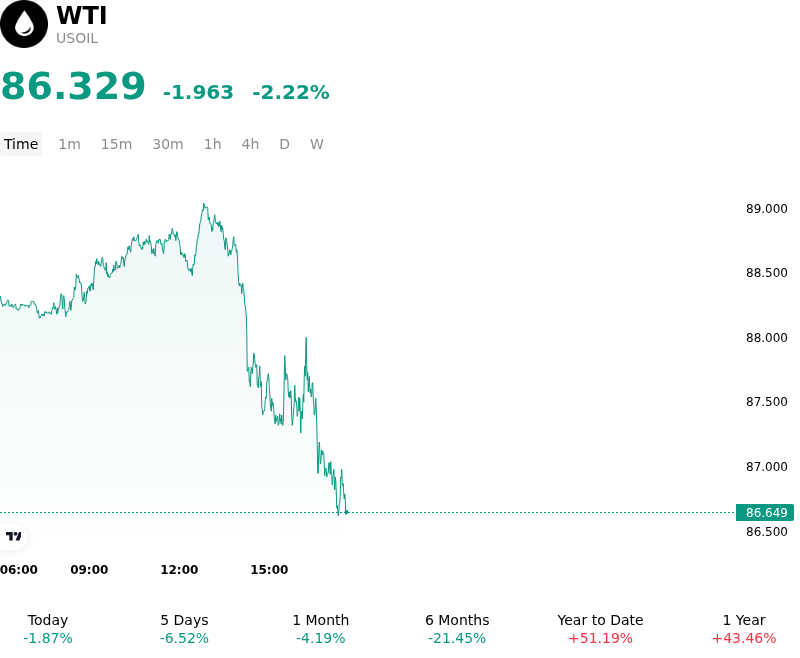
WTI (USOIL) is down 2.22% at Oct 6 05:35(ET), now at $86.329, with a 7-day down of 2.09%.
What is driving WTI (USOIL)’s stock price down today?
The downward movement in WTI crude oil was primarily driven by strategic supply interventions and easing immediate availability concerns. Global energy markets repriced supply expectations following coordinated commitments by major industrial nations to release significant volumes from strategic fuel reserves to buffer market tightness. This influx of government-held inventory dampened near-term supply squeeze premiums. At the same time, physical trade data indicated a faster-than-anticipated recovery in regional crude exports, signaling that seaborne supply bottlenecks were beginning to normalize despite ongoing geopolitical friction.
Supply-demand expectations were further softened by domestic refining dynamics and global output policy clarity. While OPEC+ confirmed a continuation of its baseline output targets for November, the decision was already largely priced into futures contracts, leaving market participants focused on rising physical supply elsewhere. In the U.S. domestic market, the onset of seasonal refinery maintenance increased offline refining capacity, reducing immediate domestic crude intake and stoking expectations of short-term crude inventory accumulation. Additionally, steady gains in active U.S. drilling activity and resilient non-OPEC supply growth reinforced expectations of an expanding supply buffer heading into the fourth quarter.
From a structural perspective, the price pullback reflects a recalibration of short-term market balance rather than a complete reversal of underlying macroeconomic conditions. While emergency stock releases and seasonal demand lulls provide temporary downward pressure on spot prices, market participants continue to monitor global trade route security, refined product inventory drawdowns, and macroeconomic policy shifts influencing global industrial demand. Institutional profit-taking and technical positioning following recent price advances exacerbated the session's decline, though longer-term market fundamentals remain sensitive to geopolitical developments and broader economic activity.
Technical Analysis of WTI (USOIL)
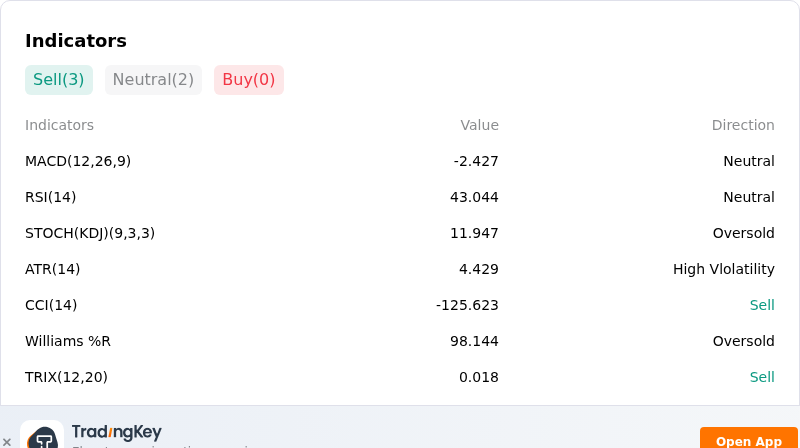
Technically, WTI (USOIL) shows a MACD (12,26,9) value of -2.427, indicating a neutral signal. The RSI at 43.044 suggests neutral condition and the Williams %R at 98.144 suggests oversold condition. Please monitor closely.
More details about WTI (USOIL)
Recent Events and Risks:
- G7 Coordinated Emergency Reserve Release: Downward price pressure has intensified following the G7 nations' agreement to release 100 million barrels of crude and diesel from strategic petroleum reserves, rapidly injecting supply into the market and eroding prompt spot premiums.
- Unexpected U.S. Crude Inventory Accumulation: Domestic fundamentals turned bearish after weekly EIA inventory data revealed an unexpected 922,000-barrel build in U.S. crude stocks and a 553,000-barrel rise at the Cushing storage hub, driven by a 554,000 barrel-per-day drop in refinery runs.
- Rebound in Persian Gulf Export Volumes: Market anxiety over immediate physical supply disruptions has abated as Persian Gulf crude oil exports recovered back toward pre-conflict levels, triggering a swift unwind of the geopolitical risk premium embedded in WTI futures.
- Repeated Global Demand Downgrades and Speculative Liquidation: Sentiment remains weighed down after OPEC executed its fifth consecutive downward revision to global oil demand growth projections, prompting heavy long liquidation and a sharp reduction in non-commercial net-long futures contracts.
Recommended Articles


