


BNB (BNBUSD) Suddenly Goes up 1.06% on Sep 24: What You Need to Watch
BNB (BNBUSD) is up 1.06% at Sep 24 22:45(ET), now at $771.5, with a 7-day up of 5.28%.
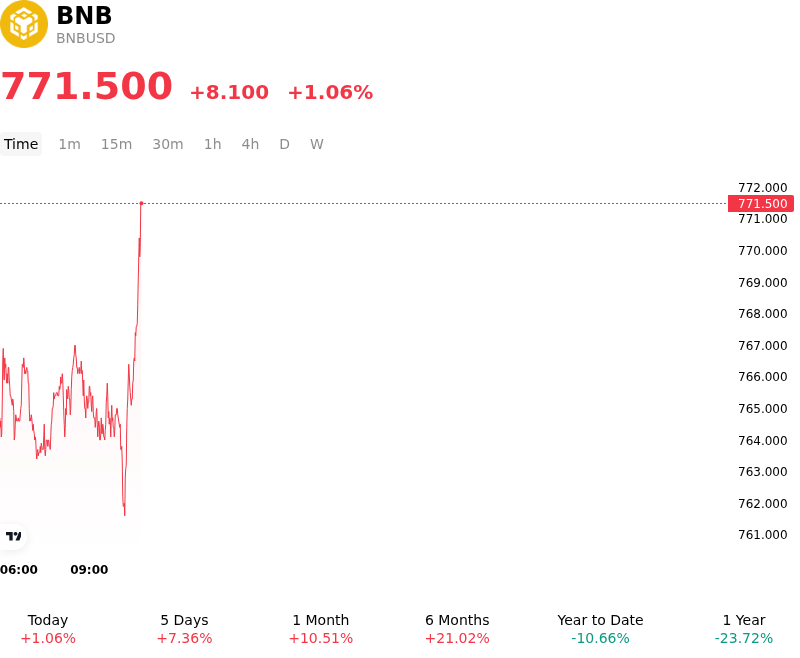
What is driving BNB (BNBUSD)’s stock price up today?
Capital flowed into BNB as investor sentiment was bolstered by strategic platform developments on the Binance exchange and expanding utility expectations across the BNB Chain ecosystem. A primary catalyst driving demand was the exchange's formalization of its multi-asset trading infrastructure, which established BNB as a core settlement asset alongside key stablecoins for upcoming equities, options, and tokenized asset products. This structural integration reinforced the long-term utility narrative of the token, reassuring institutional participants of its embedded role within Binance's expanding global market venue. Additionally, broader momentum around tokenized stock frameworks highlighted BNB Chain as a key beneficiary network, encouraging capital allocation from traders positioning for real-world asset volume growth.
The advance occurred within a favorable macro backdrop characterized by resilient broader risk appetite. As global markets absorbed recent Federal Reserve monetary policy adjustments and equity markets held near elevated levels, digital asset capital rotated from mega-cap cryptocurrencies into high-liquidity, large-cap ecosystem tokens. This rotation was further propelled by an shift in broader market breadth, where sustained demand for exchange-linked utility assets provided a steady tailwind against short-term market consolidation.
On-chain and derivatives dynamics further supported the upward trajectory. High transaction throughput on the BNB Chain, driven by decentralized exchange activity and token deployment platforms, generated consistent baseline demand for native gas fees. In the derivatives market, the move above key technical moving averages triggered localized short covering, forcing bearish leverage out of the market and accelerating intraday momentum near technical resistance levels. The combination of spot accumulation, fee utility, and leverage rebalancing created favorable market depth to absorb selling pressure.
While the immediate price action reflects strengthening ecosystem fundamentals and improved risk appetite, institutional investors maintain focus on underlying liquidity conditions and regulatory developments. Sustained growth in on-chain financial activity and exchange volume remains critical to supporting BNB's long-term valuation trajectory amidst ongoing macroeconomic shifts.
Technical Analysis of BNB (BNBUSD)
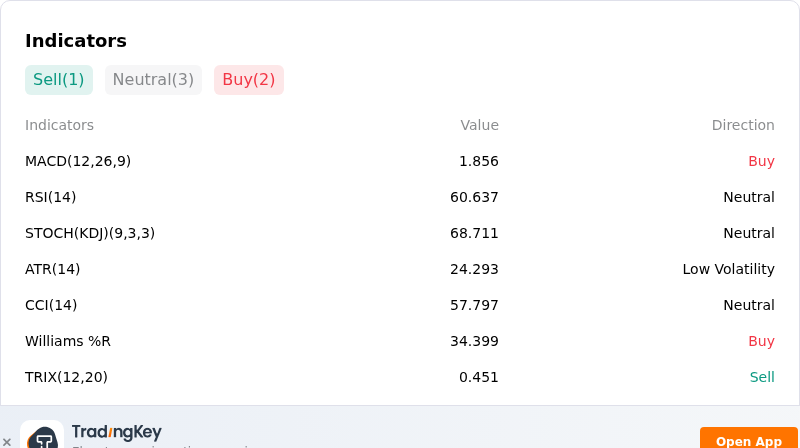
Technically, BNB (BNBUSD) shows a MACD (12,26,9) value of 1.856, indicating a buy signal. The RSI at 60.637 suggests neutral condition and the Williams %R at 34.399 suggests buy condition. Please monitor closely.
More details about BNB (BNBUSD)
Recent Events and Risks:
- Overhead Resistance Rejection and Short-Term Exhaustion: BNB's failure to maintain momentum above the $800 psychological threshold has triggered immediate profit-taking near major technical resistance. Cooling momentum on lower timeframes—marked by negative MACD histograms and elevated daily RSI readings—heightens the risk of a deeper technical retracement toward lower support boundaries.
- Derivatives Leverage and Liquidation Exposure: Elevated long positioning in perpetual futures contracts leaves the market vulnerable to sudden intraday downside volatility. Concentrated leverage clusters near immediate consolidation levels create the risk of automated liquidation cascades if key support zones give way.
- Persistent Regulatory and Compliance Friction: Broad regulatory scrutiny surrounding Binance operations and ongoing licensing hurdles under the European Union's MiCA framework continue to create headline risk, suppressing institutional confidence and imposing a risk premium on ecosystem-linked assets.
- On-Chain Fee Contraction and Decentralized Activity Volatility: Recent on-chain metrics reveal localized cooling across BNB Chain applications, highlighted by a sharp 24-hour decline in PancakeSwap transaction fee generation and capital rotation toward competing Layer-2 networks, dampening organic spot demand for the underlying token.
Recommended Articles


