


Worried About a Stock Market Crash? History Says Not So Fast.
Key Points
It is emotionally difficult to invest through a bear market.
But the history of the S&P 500 is very clear: Sticking to a long-term investment plan is better than panicking.
- 10 stocks we like better than Vanguard S&P 500 ETF ›
If you are a relatively new investor, you may have never experienced a really deep and prolonged bear market. Sure, there have been some swift drops, but nothing like the pain that was meted out during the dot-com bubble or the Great Recession. This is why it is so concerning that the artificial intelligence bubble brewing today has pushed the market back to valuation levels last seen before the dot-com bubble burst. We could be in for a doozie of a downturn, but don't let that freak you out too much. Here's why.
Bear markets are a part of investing
Bull markets feel great, but stocks don't go up forever in a straight line. A jagged pattern is the norm. And, for better or worse, sometimes the jagged pattern includes some pretty dramatic downdrafts. Bear markets are the deepest of the drawdowns, and they are just as normal as bull markets. But stocks don't go down forever, either. You have to take the good (bull markets) with the bad (bear markets) if you are going to invest in stocks.
Missed AI’s "Act 1"? Act 2 Could Be 15x Bigger. Most investors think they missed the AI boat because they didn't buy Nvidia in 2005. But according to our analysts, we’re only at the end of "Act 1"—the R&D phase. "Act 2" is the global rollout. Continue »

Image source: Getty Images.
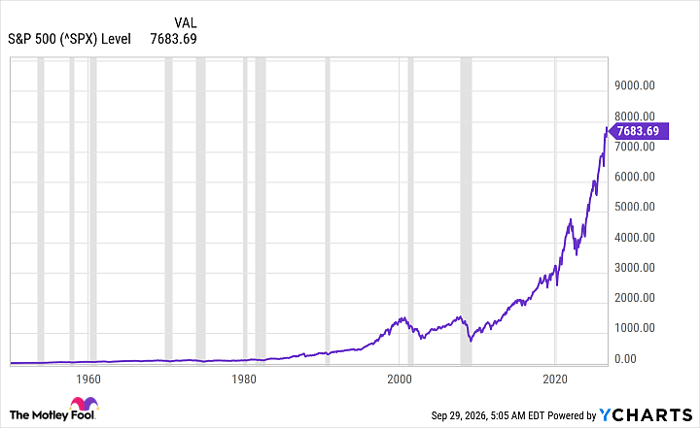
Luckily, however, we have a very long history to draw on for clues about what to expect in the future. While past performance doesn't predict future returns, the S&P 500 index (SNPINDEX: ^GSPC) has steadily grown alongside the U.S. economy over the long term. That makes total sense, since the S&P 500 index is specifically designed to be representative of the U.S. economy.
^SPX data by YCharts
What's notable is that every bear market in history has been followed by a bull market. And the new bull markets have always taken the S&P 500 index to new highs. In fact, some of the worst bear markets in Wall Street history, the dot-com crash and the Great Recession, are just blips in the S&P 500's steady march higher today. This is clear evidence that a buy-and-hold approach is a good one for long-term investors.
Easy to get on the train, but make sure you stay on it
The truth is, simply buying an S&P 500 exchange-traded fund like SPDR S&P 500 Trust (NYSEMKT: SPY), the first ETF ever created, or Vanguard S&P 500 ETF (NYSEMKT: VOO) is a solid investment decision. The hard part will be sticking with either ETF through both bull markets and bear markets. If you do, Wall Street history strongly suggests that you will do just fine, even if you buy at the top of a bull market. In fact, over the long term, it is probably more important that you start saving and investing than that you get your entry point perfectly right.
Should you buy stock in Vanguard S&P 500 ETF right now?
Before you buy stock in Vanguard S&P 500 ETF, consider this:
The Motley Fool Stock Advisor analyst team just identified what they believe are the 10 best stocks for investors to buy now… and Vanguard S&P 500 ETF wasn’t one of them. The 10 stocks that made the cut could produce monster returns in the coming years.
Consider when Netflix made this list on December 17, 2004... if you invested $1,000 at the time of our recommendation, you’d have $361,650!* Or when Nvidia made this list on April 15, 2005... if you invested $1,000 at the time of our recommendation, you’d have $1,437,517!*
Now, it’s worth noting Stock Advisor’s total average return is 936% — a market-crushing outperformance compared to 211% for the S&P 500. Don't miss the latest top 10 list, available with Stock Advisor, and join an investing community built by individual investors for individual investors.
See the 10 stocks »
*Stock Advisor returns as of October 4, 2026.
Reuben Gregg Brewer has no position in any of the stocks mentioned. The Motley Fool has positions in and recommends Vanguard S&P 500 ETF. The Motley Fool has a disclosure policy.
Recommended Articles


