


BNB (BNBUSD) Is up 1.14% on Sep 17: Why It Happened
BNB (BNBUSD) is up 1.14% at Sep 17 20:25(ET), now at $726.8, with a 7-day up of 1.94%.
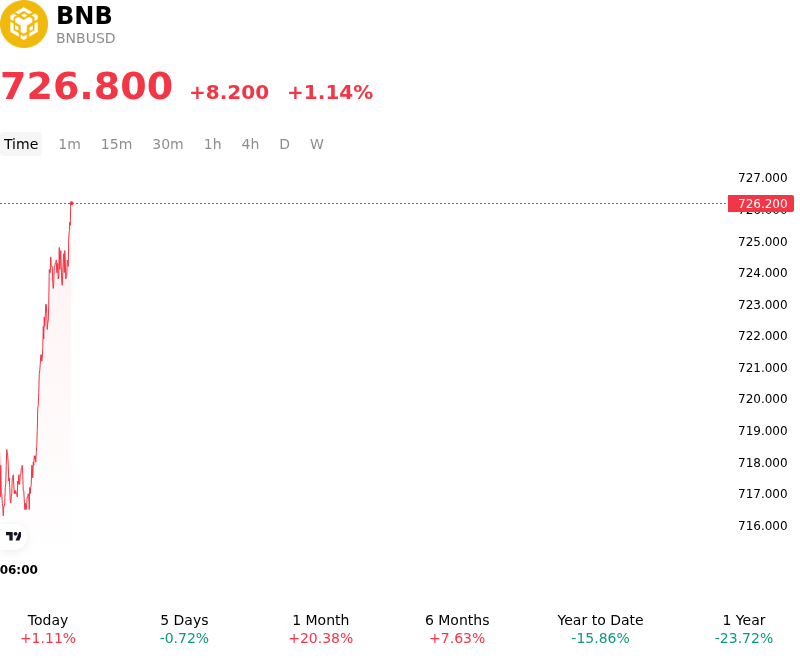
What is driving BNB (BNBUSD)’s stock price up today?
The advance in BNB reflects a combination of solid network fundamentals, rising ecosystem utility, and supportive institutional positioning across the broader digital asset landscape. Global macroeconomic conditions remain constructive as market participants price in monetary policy easing expectations ahead of central bank decisions, bolstering overall risk appetite and spot capital flows into major crypto assets. Against this backdrop, BNB experienced sustained demand driven by robust chain metrics and improving network capacity following recent protocol optimizations, including the activation of the Pasteur hardfork and an increased block gas limit, which enhanced transaction efficiency and throughput across the decentralized ecosystem.
On-chain fundamentals further strengthened investor sentiment following recent industry analytics highlighting the network's leadership in real-world asset tokenization growth. The substantial expansion in tokenized assets on the network underscores expanding enterprise adoption and institutional trust in the underlying execution environment. Simultaneously, the core utility of BNB continues to absorb liquid circulating supply through platform ecosystem mechanisms, such as structured yield products, Launchpool allocations, and automated token distribution models, which incentivize long-term locking of spot tokens. In derivatives markets, holding firm above key technical support levels triggered systematic short covering and defensive positioning resets, allowing spot capital inflows to drive the asset higher.
From a structural perspective, the upward momentum demonstrates a healthy convergence of real network usage, ongoing token burn supply contraction, and broader liquidity tailwinds rather than a purely speculative intraday move. However, institutional investors continue to monitor key risk parameters, including ongoing global regulatory developments surrounding exchange-affiliated utility assets, macro interest rate volatility, and potential shifts in derivative leverage concentration across major trading venues. Provided on-chain transaction volumes and ecosystem capital lockups remain resilient, the broader outlook for BNB continues to be anchored by its fundamental utility and structural supply dynamics.
Technical Analysis of BNB (BNBUSD)
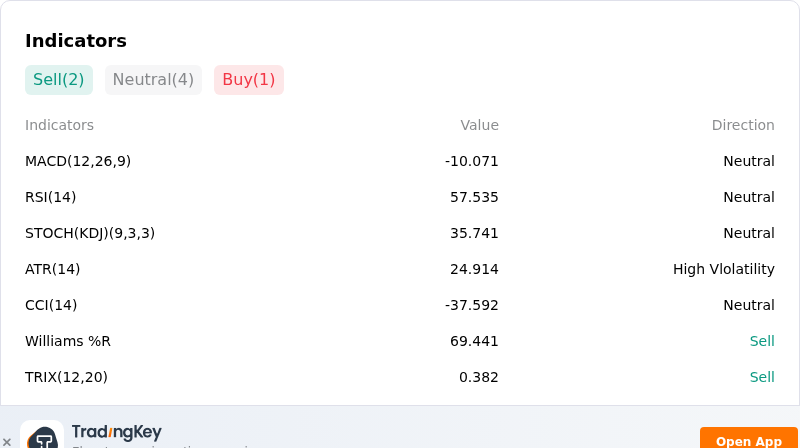
Technically, BNB (BNBUSD) shows a MACD (12,26,9) value of -10.071, indicating a neutral signal. The RSI at 57.535 suggests neutral condition and the Williams %R at 69.441 suggests sell condition. Please monitor closely.
More details about BNB (BNBUSD)
Recent Events and Risks:
- U.S. Legislative Setbacks and Regulatory Overhang: The failure of a procedural vote on the U.S. CLARITY Act triggered broader market de-risking, directly impacting BNB alongside persistent regulatory scrutiny under European MiCA compliance frameworks and Binance's ongoing legal monitorship obligations.
- Technical Resistance Rejection and Long Unwinding: After failing to hold technical resistance in the $740–$770 range, BNB experienced rapid profit-taking and an unwinding of leveraged perpetual long positions, driving prices down toward key support near $700–$710.
- DeFi Looping Collateral and Cascading Liquidation Exposure: Heavy leverage accumulation across BNB Chain lending protocols—where major whale addresses have deposited BNB as collateral to borrow stablecoins—leaves the market vulnerable to automated liquidation cascades if price breaches critical support levels.
- Macro Liquidity Strain Ahead of Central Bank Rate Decisions: Broad risk-off sentiment driven by rising Treasury yields and policy uncertainty surrounding upcoming Federal Reserve interest rate announcements has constrained overall order book liquidity and accelerated sell-side pressure.
Recommended Articles


