


HCA Healthcare Inc Stock (HCA) Moved Up by 5.26% on Sep 9: What Signal Does It Send?
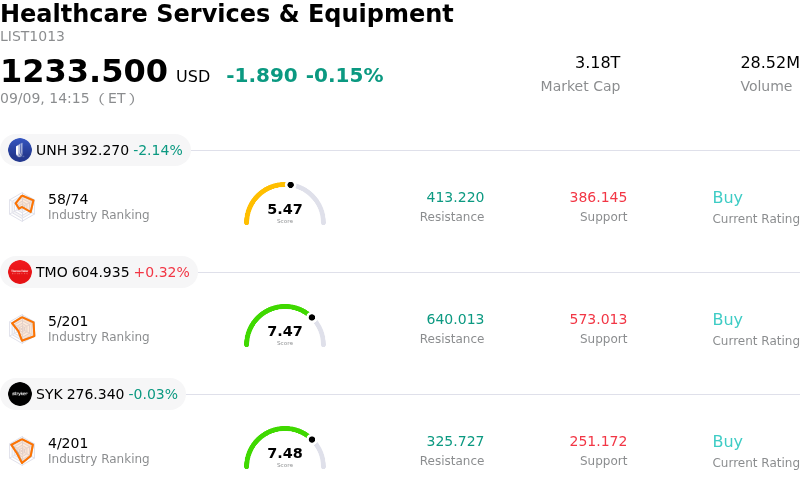
HCA Healthcare Inc (HCA) moved up by 5.26%. The Healthcare Services & Equipment sector is down by 0.15%. The company outperformed the industry. Top 3 stocks by turnover in the sector: Unitedhealth Group Inc (UNH) down 2.14%; Thermo Fisher Scientific Inc (TMO) up 0.32%; Stryker Corp (SYK) down 0.03%.
What is driving HCA Healthcare Inc (HCA)’s stock price up today?
HCA Healthcare experienced strong upward momentum driven primarily by encouraging management commentary during a major institutional healthcare conference. Executives reaffirmed the underlying operational resilience of the nation's largest hospital network, offering clarity on patient volume trajectory and margin stability. Management highlighted that the overwhelming majority of its business units are performing at or above expectations, with core operating profit growth tracking toward the top of its historical multi-year target range. This reassuring outlook effectively relieved market concerns surrounding policy-related payer mix disruptions, particularly those stemming from the expiration of enhanced exchange tax credits, by demonstrating that robust commercial inpatient volumes and Medicaid supplemental funding offsets remain sufficient to protect core cash flows.
Confidence was further reinforced by strategic updates detailing ongoing network optimization and disciplined cost management. The company outlined significant ongoing capital deployment toward expanding outpatient capacity, urgent care facilities, and technology-driven efficiency programs, including enterprise artificial intelligence implementation. Coupled with recent corporate cost structure rationalizations designed to buffer against lingering inflationary pressures and rising uncompensated care costs, these measures reassured institutional investors that HCA retains superior operating leverage over regional healthcare operators.
The surge was amplified by favorable institutional positioning and attractive valuation dynamics. Following a period of share price weakness linked to earlier annual guidance revisions, the stock traded at a notable valuation discount compared to broader industry averages. Reaffirmed positive analyst ratings and bullish target price projections highlighted the expanding gap between the stock's discounted market multiple and its fundamental cash-generating capability. As executive commentary extinguished downside tail risks, institutional buyers stepped in, sparking a decisive intraday rally driven by fundamental re-rating and momentum buying.
Technical Analysis of HCA Healthcare Inc (HCA)
Technically, HCA Healthcare Inc (HCA) shows a MACD (12,26,9) value of -2.845, indicating a neutral signal. The RSI at 57.712 suggests neutral condition and the Williams %R at 33.199 suggests buy condition. Please monitor closely.
Fundamental Analysis of HCA Healthcare Inc (HCA)
HCA Healthcare Inc (HCA) is in the Healthcare Services & Equipment industry. Its latest annual revenue is $75.60B, ranking 7 in the industry. The net profit is $6.78B, ranking 2 in the industry. Company Profile
Over the past month, multiple analysts have rated the company as Buy, with an average price target of $453.21, a high of $579.00, and a low of $380.00.
More details about HCA Healthcare Inc (HCA)
Company Specific Risks:
- Adverse Payer Mix Shift & ACA Coverage Losses: Accelerating loss of individual health insurance exchange coverage has expanded uninsured patient volumes, driving an estimated $1.0 billion to $1.2 billion unfavorable EBITDA impact for the fiscal year.
- Contraction in High-Margin Surgical Volumes: Operational weakness is highlighted by declining year-over-year same-facility inpatient and outpatient surgical procedures, directly threatening revenue generation from high-margin elective care.
- Pending Securities Fraud & Disclosure Investigations: Multiple law firms have launched formal inquiries into potential federal securities law violations following executive management's sharp downgrade to full-year net income and EPS guidance.
- Elevated Operating Cost Structure: Persistent cost pressures from hospital-based physician fees, agency labor staffing, and medical supplies continue to compress operating margins across regional facility networks.
Recommended Articles


