


Bitcoin (BTCUSD) Is up 1.00% on Sep 9: Why It Happened
Bitcoin (BTCUSD) is up 1.00% at Sep 9 01:15(ET), now at $79243.84, with a 7-day up of 2.41%.
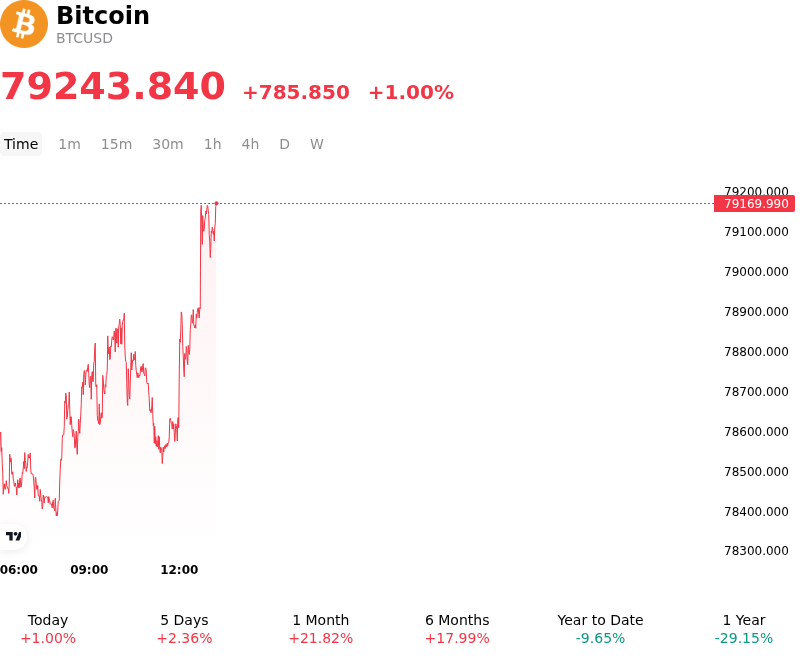
What is driving Bitcoin (BTCUSD)’s stock price up today?
Bitcoin recorded a notable intraday advance as persistent spot market demand and resilient institutional inflows reasserted control following a period of tight range-bound consolidation. Capital inflows into spot Bitcoin ETFs provided essential liquidity, counteracting recent macro-driven risk aversion and absorbing residual overhead supply. Institutional participants leveraged the stability near key technical support levels to re-establish long positions, reinforcing market confidence and stabilizing spot prices. This spot-led momentum was further amplified by ongoing corporate treasury accumulation, which continues to provide a structural demand floor for the digital asset ecosystem.
Derivatives market positioning significantly contributed to the intraday price action and elevated volatility. A brief push above localized resistance triggered a cluster of short-position liquidations, driving forced buy-backs that accelerated upward price velocity. Aggregate futures open interest adjusted as leveraged traders repositioned for a potential momentum expansion. Concurrently, on-chain metrics signaled a decline in miner selling pressure, as miner outflow volumes normalized following earlier operational capex adjustments. The reduction in active exchange inflows from large holders created a tighter liquid supply environment, enabling modest capital inflows to generate amplified price upside.
From a macroeconomic perspective, the price recovery reflects a tactical recalibration of risk sentiment as market participants digested shifting expectations surrounding Federal Reserve monetary policy and benchmark Treasury yield trajectories. While broader financial markets remain sensitive to inflation prints and dollar strength, Bitcoin's resilience highlights its growing narrative duality as both a high-beta risk asset and an institutional portfolio diversifier. Moving forward, institutional investors will closely monitor spot ETF net flow sustainability, broader liquidity conditions, and key macroeconomic updates to evaluate whether this rebound represents a temporary short squeeze or the onset of a broader structural continuation toward higher price channels.
Technical Analysis of Bitcoin (BTCUSD)
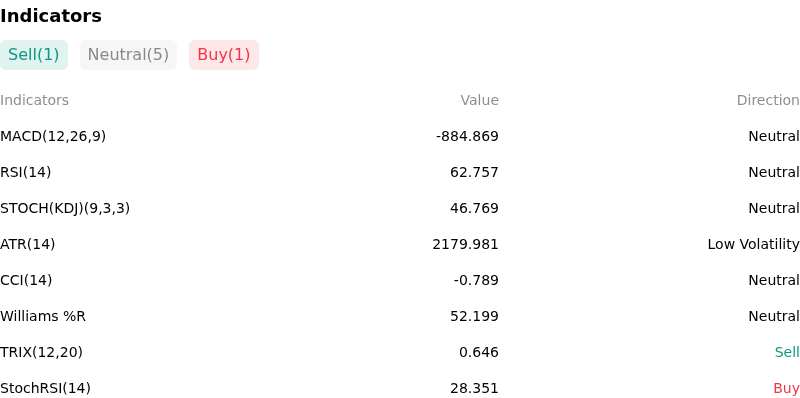
Technically, Bitcoin (BTCUSD) shows a MACD (12,26,9) value of -884.869, indicating a neutral signal. The RSI at 62.757 suggests neutral condition and the Williams %R at 52.199 suggests neutral condition. Please monitor closely.
More details about Bitcoin (BTCUSD)
Recent Events and Risks:
- Hawkish Monetary Policy Pricing and Yield Pressures: Stronger-than-expected U.S. employment data and elevated core inflation metrics have pushed market-implied odds of a Federal Reserve interest rate hike to nearly 60%, driving Treasury yields higher and increasing broad macroeconomic selling pressure on Bitcoin.
- Spot ETF Capital Outflows and Fading Institutional Demand: U.S. spot Bitcoin ETFs registered a sharp reversal in capital flows, marked by over $236 million in net daily outflows led by $201 million in redemptions from BlackRock's IBIT, while a negative Coinbase Bitcoin Premium Index signals lagging U.S. spot buyer absorption.
- Overhead Technical Rejection and Leverage Flushing: Repeated rejections at the $82,000–$82,800 overhead resistance zone triggered a flush of overextended long futures positions, leaving market structure vulnerable to a deeper retest of support near $77,000 amid contracting 30-day on-chain demand.
- Liquid Network Exploit and Infrastructure Vulnerability: A major security incident on the Bitcoin Liquid Network resulted in the unauthorized withdrawal of nearly 4,000 BTC (~$320 million) due to an Elements software bug, forcing operators to temporarily pause sidechain peg-outs and stoking security concerns across Bitcoin infrastructure.
Recommended Articles


