


USD/JPY (USDJPY) Is down 0.53% on Sep 9: What Is Behind the Currency Move?
USD/JPY (USDJPY) is down 0.53% at Sep 9 02:05(ET), now at $153.131, with a 7-day down of 3.50%.
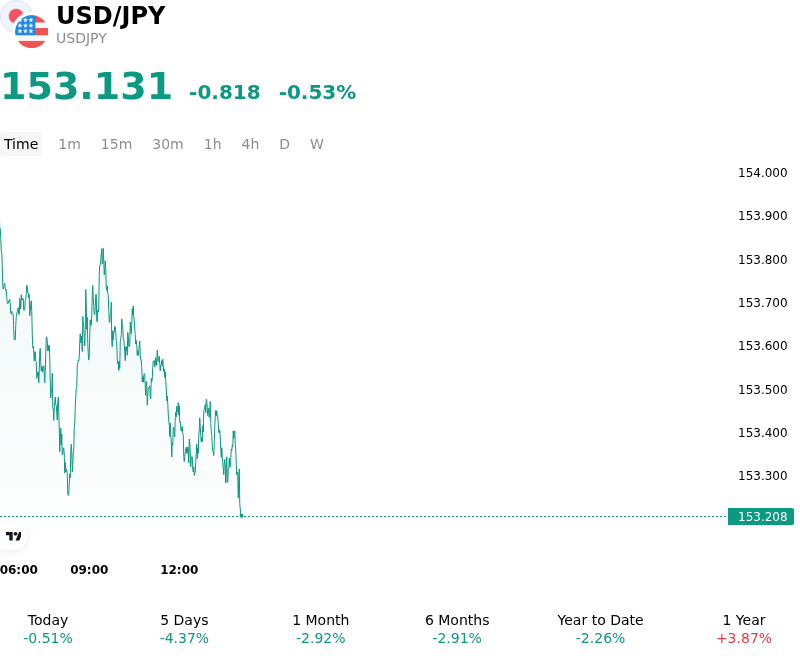
What is driving USD/JPY (USDJPY)’s stock price down today?
The downward movement in USDJPY was primarily driven by aggressive market repricing of Bank of Japan policy tightening alongside a sharp unwinding of yen-funded carry trades. Investors increasingly priced in a high probability of an interest rate hike at the upcoming Bank of Japan monetary policy meeting, bolstered by hawkish communications from central bank policymakers and robust domestic fundamental data. Upwardly revised second-quarter Japanese gross domestic product figures confirmed the economy's underlying resilience, reinforcing the view that domestic macroeconomic conditions remain supportive of policy normalization. As Japanese government bond yields expanded, domestic institutional investors showed increased appetite for capital repatriation, bolstering structural demand for the yen relative to the greenback.
The decline gained mechanical momentum as the currency pair breached key structural technical support levels around 155.00, triggering a wave of stop-loss orders and systematic liquidations of long dollar positions. Institutional order flow reflected a notable shift in positioning, with macro hedge funds aggressively accumulating downside options targeting lower exchange rate levels. Downside momentum was further amplified by official policy signals, notably after US Treasury Secretary Scott Bessent issued explicit warnings against speculative position-building against the yen, highlighting diminished official tolerance for excessive yen weakness and discouraging tactical dip-buying in the pair.
On the dollar side of the equation, the greenback remained on the defensive as market participants adopted a cautious stance ahead of critical US inflation data, which will refine expectations for the Federal Reserve's monetary trajectory. Although recent US economic indicators reflected steady labor market activity, narrowing US-Japan yield differentials continued to pressure USDJPY as monetary policy expectations in Tokyo outpaced marginal adjustments in US rate pricing. Furthermore, geopolitical friction in the Middle East and rising global energy prices induced a broader risk-sensitive backdrop that favored safe-haven capital flows into the Japanese currency. While technical conditions could prompt brief consolidation periods, the broader move is anchored by fundamental policy convergence and systemic repositioning across global financial markets.
Technical Analysis of USD/JPY (USDJPY)
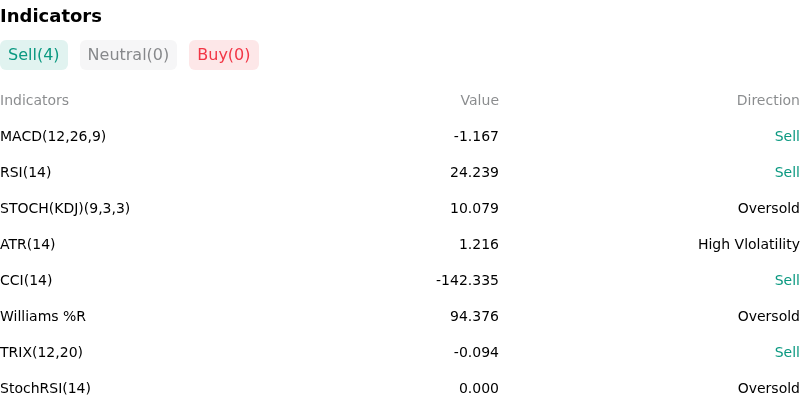
Technically, USD/JPY (USDJPY) shows a MACD (12,26,9) value of -1.167, indicating a sell signal. The RSI at 24.239 suggests sell condition and the Williams %R at 94.376 suggests oversold condition. Please monitor closely.
More details about USD/JPY (USDJPY)
Recent Events and Risks:
- Hawkish Bank of Japan Rate Hike Repricing: Money market pricing for a 25-basis-point Bank of Japan rate hike at the September 17–18 policy meeting has surged toward 97%, reinforced by hawkish board commentary signaling potential back-to-back interest rate increases and putting intense downward momentum on USD/JPY.
- Accelerated Carry Trade Unwinding and Technical Breakdown: A decisive intraday breach below key psychological support levels at 155.00 and 154.00 triggered automated stop-loss orders and options dealer hedging, accelerating yen carry trade liquidations and exposing further downside risks toward 152.00 and 150.00.
- Persistent Japanese Ministry of Finance Intervention Risk: Continued official warnings from Japan's top foreign exchange diplomat Atsushi Mimura maintain high market sensitivity to potential official market interventions, leaving traders cautious about holding extended USD/JPY long positions amid elevated volatility.
- US CPI Release and Treasury Yield Compression Vulnerability: Upcoming US inflation data presents near-term downside volatility risk, as any softer-than-expected CPI reading could lower US Treasury yields, compress the US-Japan interest rate differential, and trigger additional dollar sell-offs.
Recommended Articles


