


Ethereum (ETHUSD) Is up 1.09% on Sep 9: What Are the Risk Factors?
Ethereum (ETHUSD) is up 1.09% at Sep 9 00:55(ET), now at $2507.62, with a 7-day up of 4.87%.
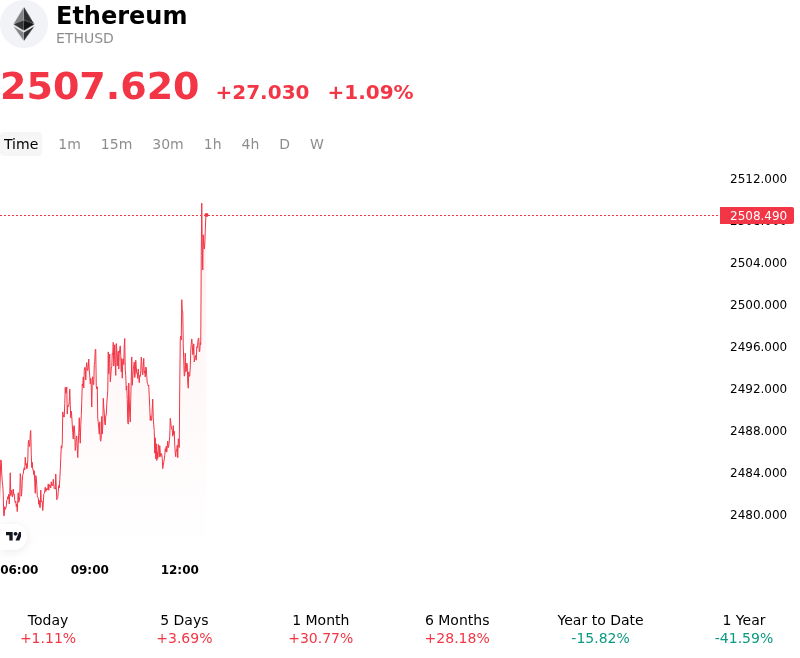
What is driving Ethereum (ETHUSD)’s stock price up today?
Macro liquidity conditions and broader risk-on sentiment provided the foundational tailwind for Ethereum during the session. A notable boost in global liquidity, driven by active U.S. Treasury debt buyback operations, eased immediate balance sheet constraints for institutional market makers and primary dealers. This cash injection helped absorb recent macroeconomic pressures, supporting asset valuations across risk-sensitive markets. As broader digital asset markets stabilized, capital re-allocated into major Layer-1 tokens, with Ethereum benefiting from improved spot market depth and renewed institutional order flow.
Asset-specific supply-demand dynamics further amplified the upward momentum. On-chain metrics highlighted a tightening structural supply backdrop as total staked Ethereum reached record highs, effectively locking up a substantial portion of circulating supply and reducing liquid reserves on centralized exchanges. This constrained availability created a favorable environment for buyers, where spot market accumulation and steady allocations into spot Ethereum exchange-traded funds generated immediate upward price pressure. Additional support stemmed from ongoing corporate treasury accumulation, alongside positive long-term sentiment surrounding the protocol's strategic roadmap and infrastructure development priorities.
From a market structure and derivatives positioning perspective, the advance was reinforced by a firm technical defense of key moving averages. After repeatedly holding above dynamic support levels, selling pressure abated, prompting tactical short covering across derivative venues. Perpetual swap funding rates stabilized while open interest expanded, indicating that the move was supported by fresh long positioning rather than speculative squeezing alone. While macro uncertainties regarding central bank interest rate trajectories remain a key risk factor for investors to monitor, the confluence of expanding market liquidity, locked on-chain supply, and sustained institutional participation underpins Ethereum's resilient market structure.
Technical Analysis of Ethereum (ETHUSD)
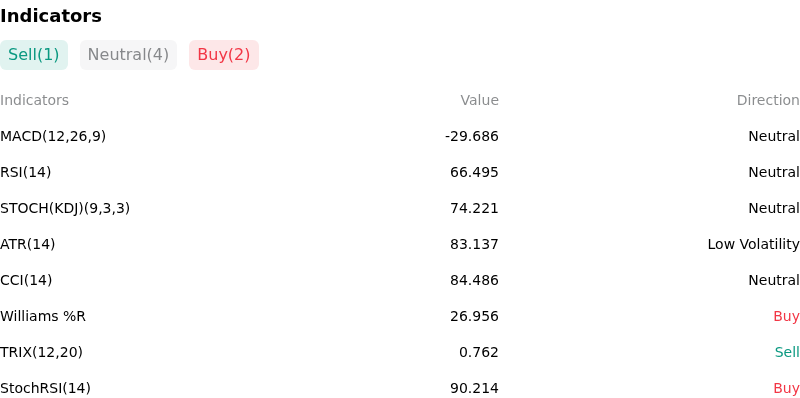
Technically, Ethereum (ETHUSD) shows a MACD (12,26,9) value of -29.686, indicating a neutral signal. The RSI at 66.495 suggests neutral condition and the Williams %R at 26.956 suggests buy condition. Please monitor closely.
More details about Ethereum (ETHUSD)
Recent Events and Risks:
- Macro Hawkishness and Rate Headwinds: Stronger-than-expected U.S. economic data and hawkish Federal Reserve signals have renewed interest rate concerns and bolstered Treasury yields, fueling a risk-off sentiment that continues to depress Ethereum spot demand.
- Derivatives Long Liquidation Risks: High long-to-short positioning ratios across major exchanges leave ETH vulnerable to sudden downside cascades, where a break below the crucial $2,450–$2,400 support zone risks unwinding hundreds of millions in leveraged long contracts.
- Institutional ETF Demand Cool-Off: U.S. spot Ethereum ETFs recently snapped a multi-week inflow streak with abrupt net outflows across key funds like BlackRock's ETHA, Fidelity's FETH, and Grayscale's ETHE, dampening immediate institutional order book depth.
- Overhead Technical Resistance and Momentum Loss: ETH faces persistent price rejections at the $2,500–$2,550 resistance band while momentum indicators like the daily RSI trend lower, indicating buyer exhaustion and increasing the likelihood of a retest of lower support levels near $2,448.
Recommended Articles


