


XRP (XRPUSD) Is up 1.22% on Sep 9: What Are the Risk Factors?
XRP (XRPUSD) is up 1.22% at Sep 9 00:25(ET), now at $1.4317, with a 7-day up of 5.94%.
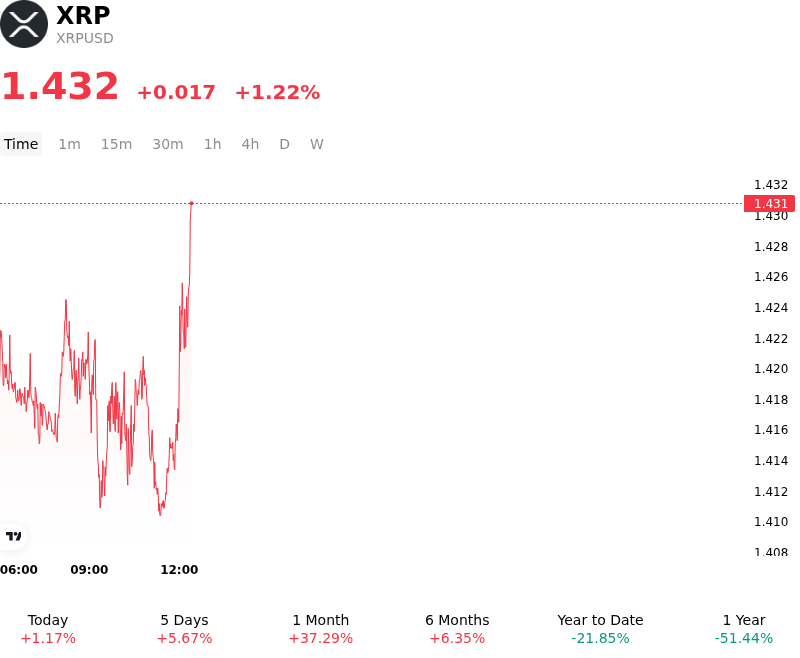
What is driving XRP (XRPUSD)’s stock price up today?
XRP experienced upward price momentum and intraday volatility as a combination of macro liquidity dynamics and policy expectations improved capital flows into the digital asset market. Risk sentiment across major digital assets received a boost as primary financial institutions processed liquidity from active US Treasury bond buyback operations, helping offset broader macroeconomic tightening concerns. Concurrently, investor attention remained focused on upcoming federal legislative developments, specifically the pending Senate vote on the CLARITY Act. The prospect of a finalized statutory framework dividing oversight between financial regulators and cementing commodity status for XRP has bolstered medium-term market expectations and encouraged fresh capital allocation.
Institutional positioning through spot XRP ETFs continues to provide underlying structural support. Steady net inflows into spot products have steadily absorbed secondary market liquidity, mitigating potential downside pressure from Ripple's scheduled monthly supply unlocks. On-chain data indicates that a substantial majority of unlocked tokens was promptly returned to escrow contracts, reassuring institutional market participants regarding controlled circulating supply metrics. Within crypto derivatives venues, open interest held firm alongside moderate positive funding rates, signaling that the move was backed by spot accumulation and structured position-building rather than speculative leverage.
Fundamentals on the XRP Ledger also contributed to positive sentiment, supported by increased payment volume and growing enterprise cross-border settlement activity. Technically, XRP demonstrated resilience near key support bands, drawing buyer demand on intraday dips to test upper resistance walls. Although broader macro risks—including Federal Reserve interest rate expectations and geopolitical headlines—continue to introduce short-term choppiness across risk assets, XRP remains well-positioned due to its expanding ETF footprint, improving regulatory backdrop, and sustained institutional engagement.
Technical Analysis of XRP (XRPUSD)
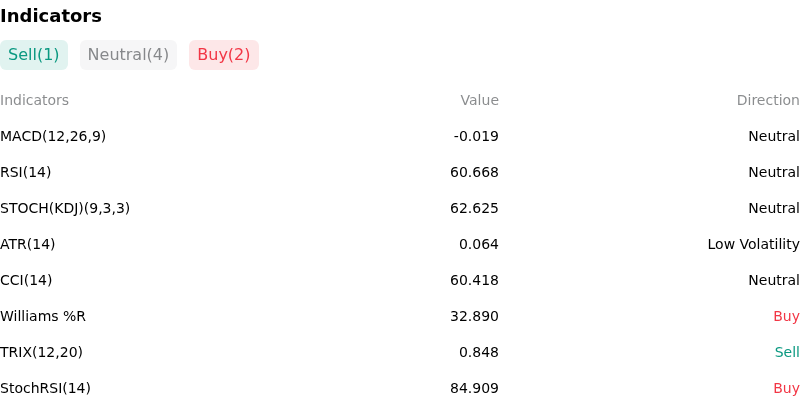
Technically, XRP (XRPUSD) shows a MACD (12,26,9) value of -0.019, indicating a neutral signal. The RSI at 60.668 suggests neutral condition and the Williams %R at 32.890 suggests buy condition. Please monitor closely.
More details about XRP (XRPUSD)
Recent Events and Risks:
- Monthly Escrow Unlock and Supply Overhang: Ripple's monthly release of 1 billion XRP from on-chain escrow injected 300 million net tokens into liquid circulation, keeping over 31 billion XRP locked in escrow and creating a persistent supply overhang that risks dampening spot price rallies.
- Derivatives Short Accumulation and Liquidation Exposure: Derivatives data reflects heavy net taker sell imbalances on Binance alongside rising open interest, signaling an increase in aggressive short positioning that leaves over-leveraged longs vulnerable to cascading liquidations if resistance near $1.50 holds.
- Legislative and Macro Policy Volatility: Headwinds from rising interest rate expectations ahead of upcoming Federal Reserve policy decisions are compounded by headline risk surrounding the U.S. Senate's procedural vote on the CLARITY Act, creating near-term uncertainty for institutional settlement adoption.
- Technical Fragility Near Critical Support Pivots: XRP continues to trade beneath an unresolved long-term death cross, with analysts highlighting that a failure to sustain price action above the $1.30 floor could trigger automated stop-loss unwinds and push spot prices down toward $1.20 and $1.00.
Recommended Articles


