


XRP (XRPUSD) Is down 1.05% on Sep 8: Key Drivers to Watch
XRP (XRPUSD) is down 1.05% at Sep 8 02:20(ET), now at $1.384, with a 7-day up of 2.20%.
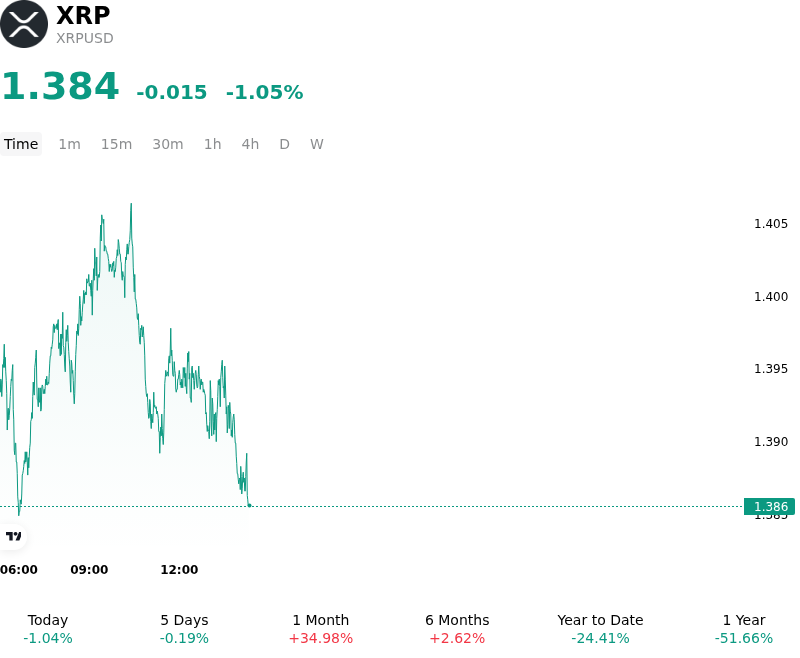
What is driving XRP (XRPUSD)’s stock price down today?
The weakness in XRPUSD reflects a combination of broader macroeconomic headwinds and localized technical resistance following a strong multi-week rally. Broader digital asset markets faced selling pressure as elevated U.S. Treasury yields and cautious Federal Reserve rate expectations dampened risk sentiment across speculative markets. For XRP specifically, price action encountered strong overhead technical resistance near key break-even levels, prompting institutional and derivative traders to take profits after substantial gains in late August. This overhead supply barrier, combined with macro-driven risk aversion, triggered long liquidations in the futures market and reduced immediate buying momentum.
Sustained supply considerations and regulatory hedging also contributed to the intraday pullback. The market continues to absorb the net expansion in circulating supply following Ripple's monthly escrow release, creating localized liquidity overhang even though a significant portion was subsequently re-locked into new time locks. Simultaneously, market participants are adopting a cautious stance ahead of impending legislative milestones, including upcoming Senate votes on market structure legislation. This regulatory uncertainty has prompted tactical de-risking among leveraged accounts, leading to a decline in aggregate open interest and a temporary weakening of spot bids around technical support zones.
Despite the immediate price softness, the underlying structural backdrop for XRP remains supported by institutional capital flows and protocol developments. Spot XRP exchange-traded funds continue to demonstrate resilient cumulative inflows, signaling that long-term institutional allocators view short-term pullbacks as accumulation opportunities rather than structural exits. Furthermore, on-chain fundamentals remain firm, characterized by strong daily transaction volumes on the XRP Ledger and anticipation surrounding the upcoming XRPL protocol upgrade aimed at enhancing institutional utility. Consequently, the intraday decline appears to be a temporary, liquidity-driven consolidation within a broader market repricing, rather than a fundamental pivot in institutional demand.
Technical Analysis of XRP (XRPUSD)
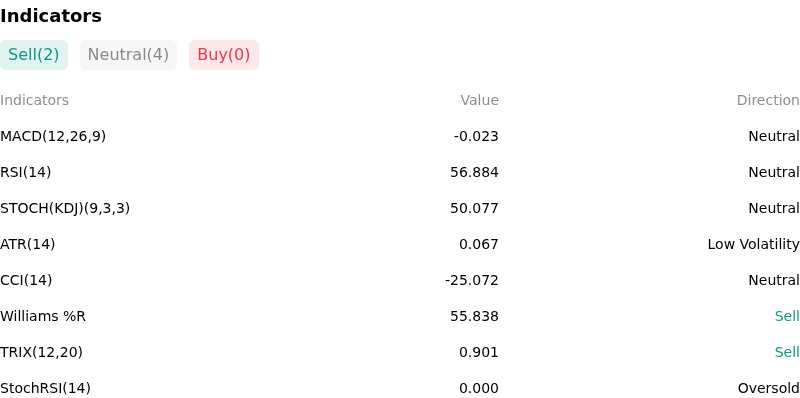
Technically, XRP (XRPUSD) shows a MACD (12,26,9) value of -0.023, indicating a neutral signal. The RSI at 56.884 suggests neutral condition and the Williams %R at 55.838 suggests sell condition. Please monitor closely.
More details about XRP (XRPUSD)
Recent Events and Risks:
- Macro Rate-Hike Fears and Long Liquidations: Stronger-than-expected U.S. labor market data sparked renewed Federal Reserve rate-hike concerns, triggering a broader crypto risk-off move that forced nearly $15 million in leveraged long liquidations across XRP derivatives and pressed prices down toward critical technical support.
- Regulatory Uncertainty and Legislative Stalls: Elevated anxiety surrounding the U.S. Senate cloture vote on the Digital Asset Market Clarity Act (CLARITY Act), alongside warnings of multi-year legislative delays if market-structure legislation fails to pass this term, has prompted tactical de-risking and options hedging among institutional traders.
- On-Chain Whale Deposits and Escrow Supply Inflows: Scheduled periodic XRP escrow releases combined with substantial whale transfers to centralized exchange wallets have heightened available spot supply, creating an overhead selling burden that repeatedly rejected buying momentum at the $1.43–$1.46 resistance level.
- Asymmetric Long Skew and Flush Risk: Although total futures open interest recently contracted by 14%, retail and top trader account ratios on major exchanges like Binance and OKX remain heavily long-biased (>2.3), leaving the asset highly vulnerable to secondary liquidation cascades if key support near $1.38 fails.
Recommended Articles


