


Ethereum (ETHUSD) Is up 1.05% on Sep 3: Why It Happened
Ethereum (ETHUSD) is up 1.05% at Sep 3 03:05(ET), now at $2416.21, with a 7-day down of 3.56%.
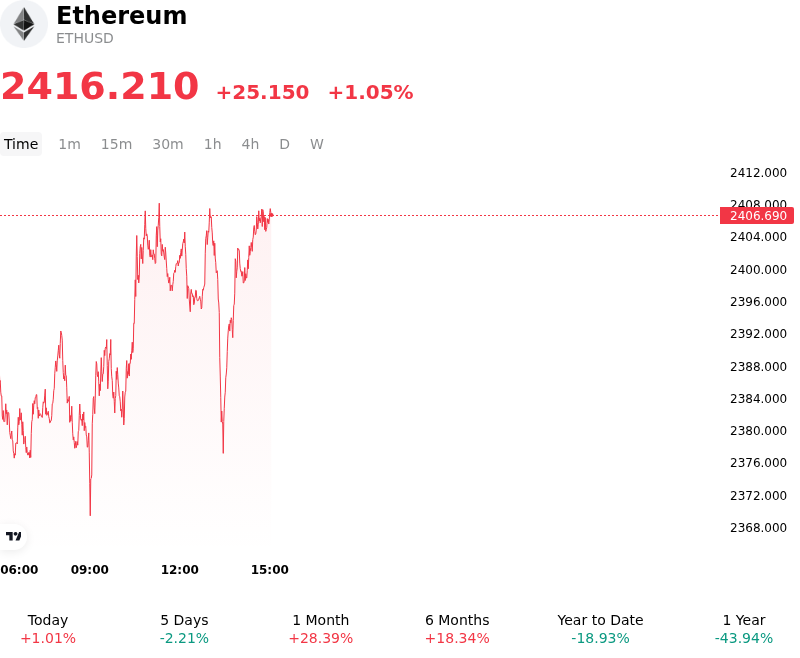
What is driving Ethereum (ETHUSD)’s stock price up today?
Macroeconomic liquidity conditions and shifting monetary policy expectations provided a constructive backdrop for Ether’s advance. Anticipation of upcoming central bank rate cuts, coupled with ongoing U.S. Treasury liquidity support measures, reinvigorated global risk appetite. As Treasury yields stabilized and the U.S. dollar faced modest downward pressure, institutional investors reallocated capital into high-beta digital assets, allowing Ether to absorb intraday volatility and push higher.
Capital rotation within the crypto ecosystem further accelerated the upward momentum. Following a period of concentrated liquidity in Bitcoin, market participants shifted focus toward core smart-contract platforms. Derivatives market positioning indicated a clearing of short leverage around key technical support levels, triggering a modest short squeeze that amplified spot buying. Concurrently, solid Layer-2 network throughput, steady decentralized finance activity, and renewed institutional dialogue surrounding long-term Ethereum valuation benchmarks bolstered spot market sentiment.
Regulatory developments and structural adoption expectations provided additional support to investor confidence. Anticipation of potential U.S. legislative progress regarding digital asset market structure reduced legal uncertainty for institutional allocators, banks, and tokenization platforms. While spot ETF flows experienced short-term divergence, the broader framework of staking yields, network upgrades, and institutional tokenization initiatives continues to support long-term accumulation expectations. Investors nevertheless remain vigilant regarding broader macroeconomic data releases and upcoming central bank policy decisions.
Technical Analysis of Ethereum (ETHUSD)
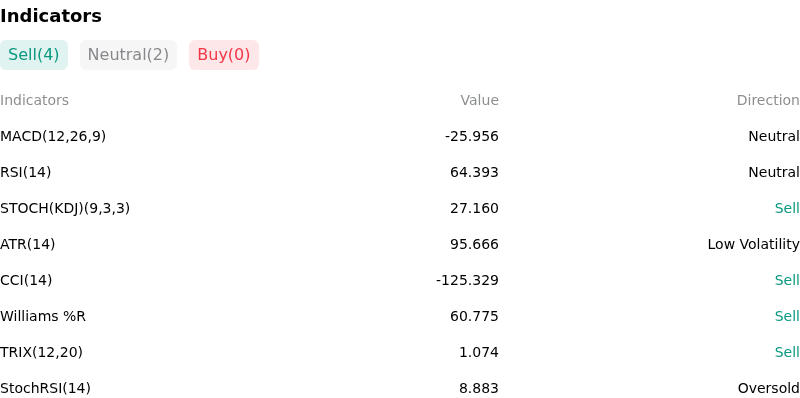
Technically, Ethereum (ETHUSD) shows a MACD (12,26,9) value of -25.956, indicating a neutral signal. The RSI at 64.393 suggests neutral condition and the Williams %R at 60.775 suggests sell condition. Please monitor closely.
More details about Ethereum (ETHUSD)
Recent Events and Risks:
- Large Whale Exchange Transfers and Selling Pressure: On-chain tracking reveals substantial deposits from major Ethereum holders and early investor wallets to centralized exchanges like Binance, increasing immediate downside spot supply and raising concerns of ongoing distribution into thin order book liquidity.
- Derivatives Long Liquidation Clusters: Derivatives market data indicates significant long leverage concentration near key support levels around $2,350–$2,400, leaving ETH highly vulnerable to sudden long liquidations and cascading forced selling if support fails to hold.
- Slowing Institutional Spot ETF Inflows: Demand across U.S. spot Ethereum ETFs has experienced a sharp deceleration after prior sustained inflows, weakening institutional absorption capacity and diminishing a key structural bid that previously mitigated downside price pressure.
- Macroeconomic Headwinds and Risk-Off Sentiment: Heightened geopolitical friction alongside sustained high interest rate expectations continue to weigh on global risk assets, driving capital away from high-beta cryptocurrencies like Ethereum toward defensive safe-haven holdings.
Recommended Articles


