

Uniswap Price Forecast: UNI rally stretches thin amid waning retail demand

Source Fxstreet
  • Uniswap is down 2% on Thursday, capped below $6.00 after rallying over 80% in more than two weeks.
  • UNI derivatives indicate a sell-side bias, with Open Interest down 12% and around $2 million in long liquidations over the last 24 hours.
  • The technical outlook for UNI indicates a pullback bias, with momentum indicators signaling an overstretched rally.

Uniswap (UNI) is down 2% on Thursday, facing fresh selling pressure near the $6.00 mark after a steady recovery of over 80% in more than two weeks. Retail speculation is beginning to fade, with UNI futures Open Interest down 12% over the last 24 hours and a long positional wipeout of more than $2 million. The technical outlook for PI suggests a downside bias as momentum stretches thin.

Retail demand is losing strength

Uniswap is losing its retail strength after a steady recovery over the last 15 days, driven by strong on-chain performance. Uniswap processed another around $2 billion in Robinhood Stock Token volume in the last 2 weeks, while swaps reached a record high of 40 million last week.
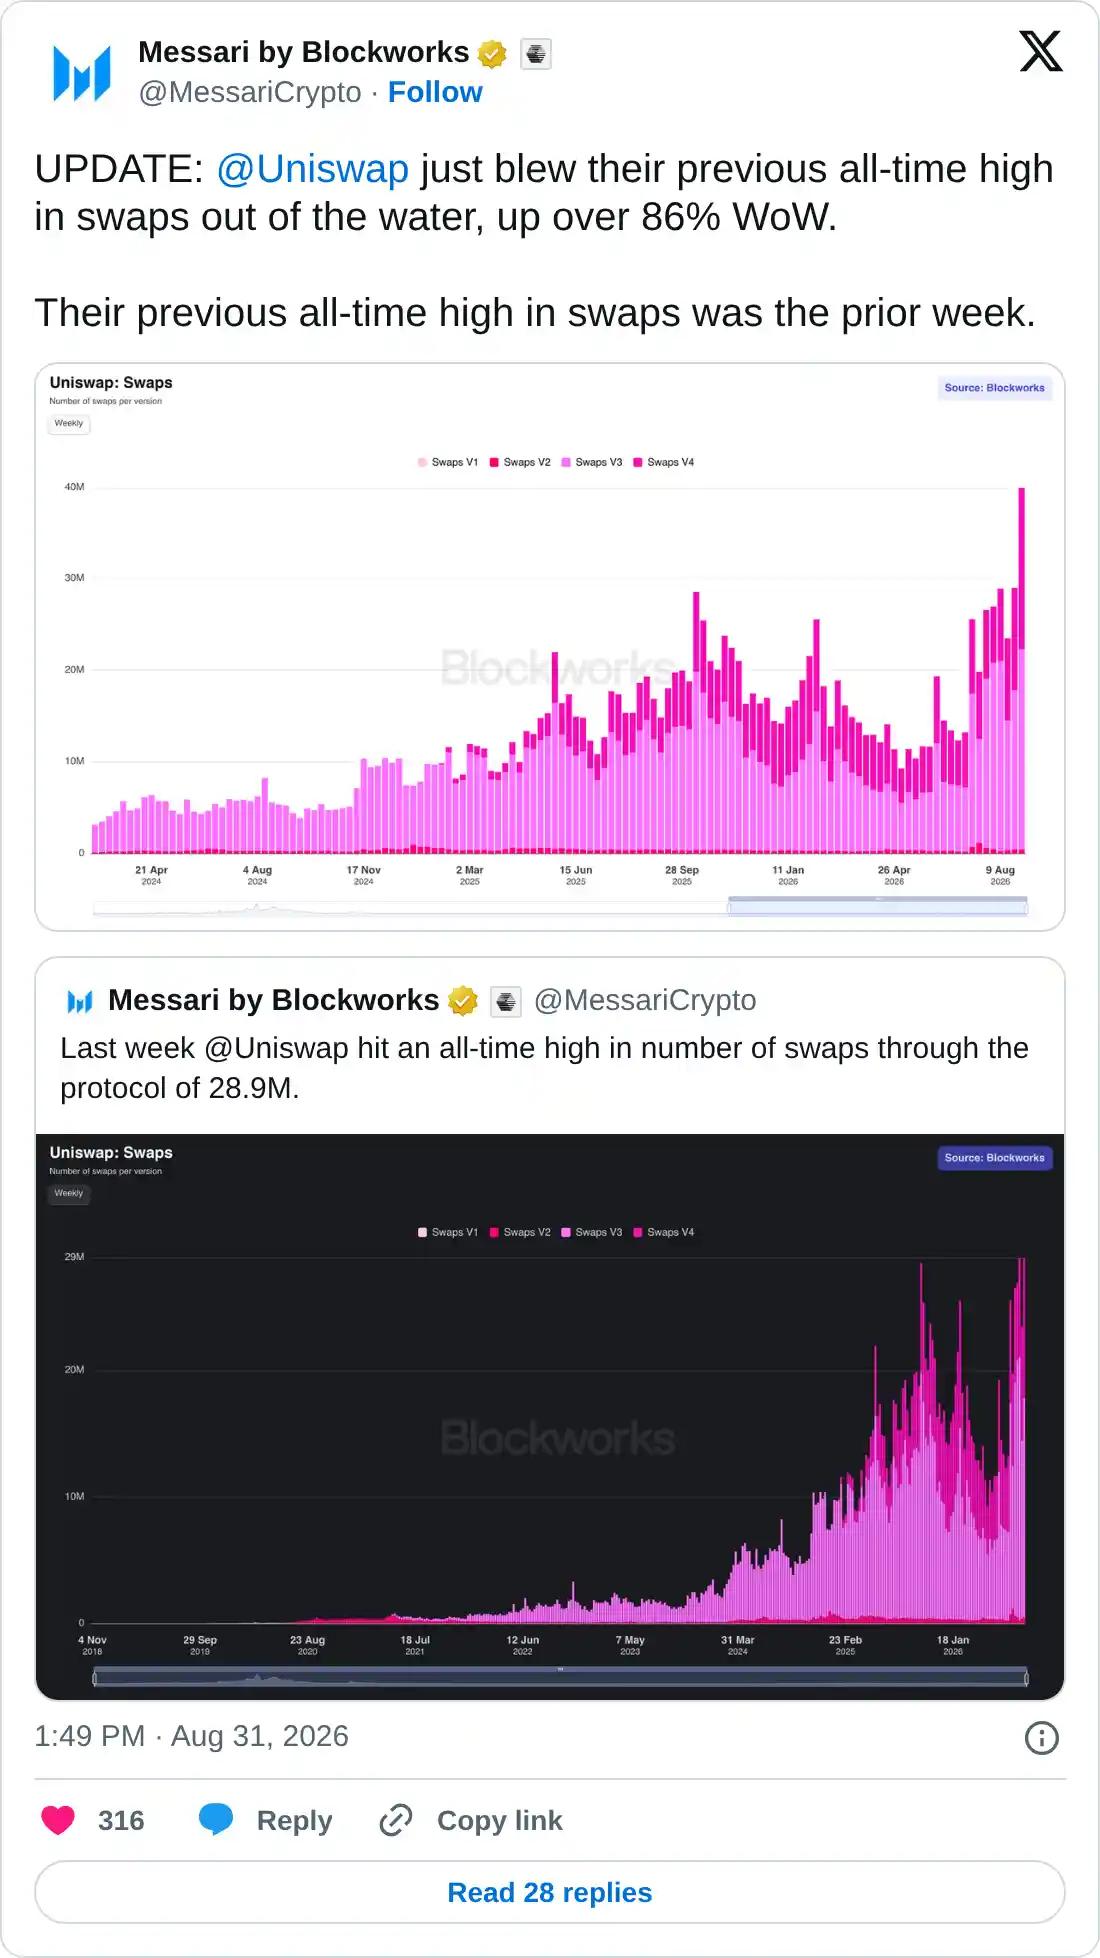
https://x.com/MessariCrypto/status/2094422338360033547

CoinGlass data shows UNI Open Interest (OI) is down 12% to $480.85 million over the last 24 hours, suggesting a positional wipeout or a reduction in notional value due to the decline in the spot price. Total liquidation of $2.85 million, led by $2.15 million in long liquidation, reaffirms the unwinding of bullish positions.

Still, the OI-weighted funding rate of 0.0094% suggests that traders are inclined to take long positions at a premium despite the higher risk of liquidation, in hopes of an extended recovery.
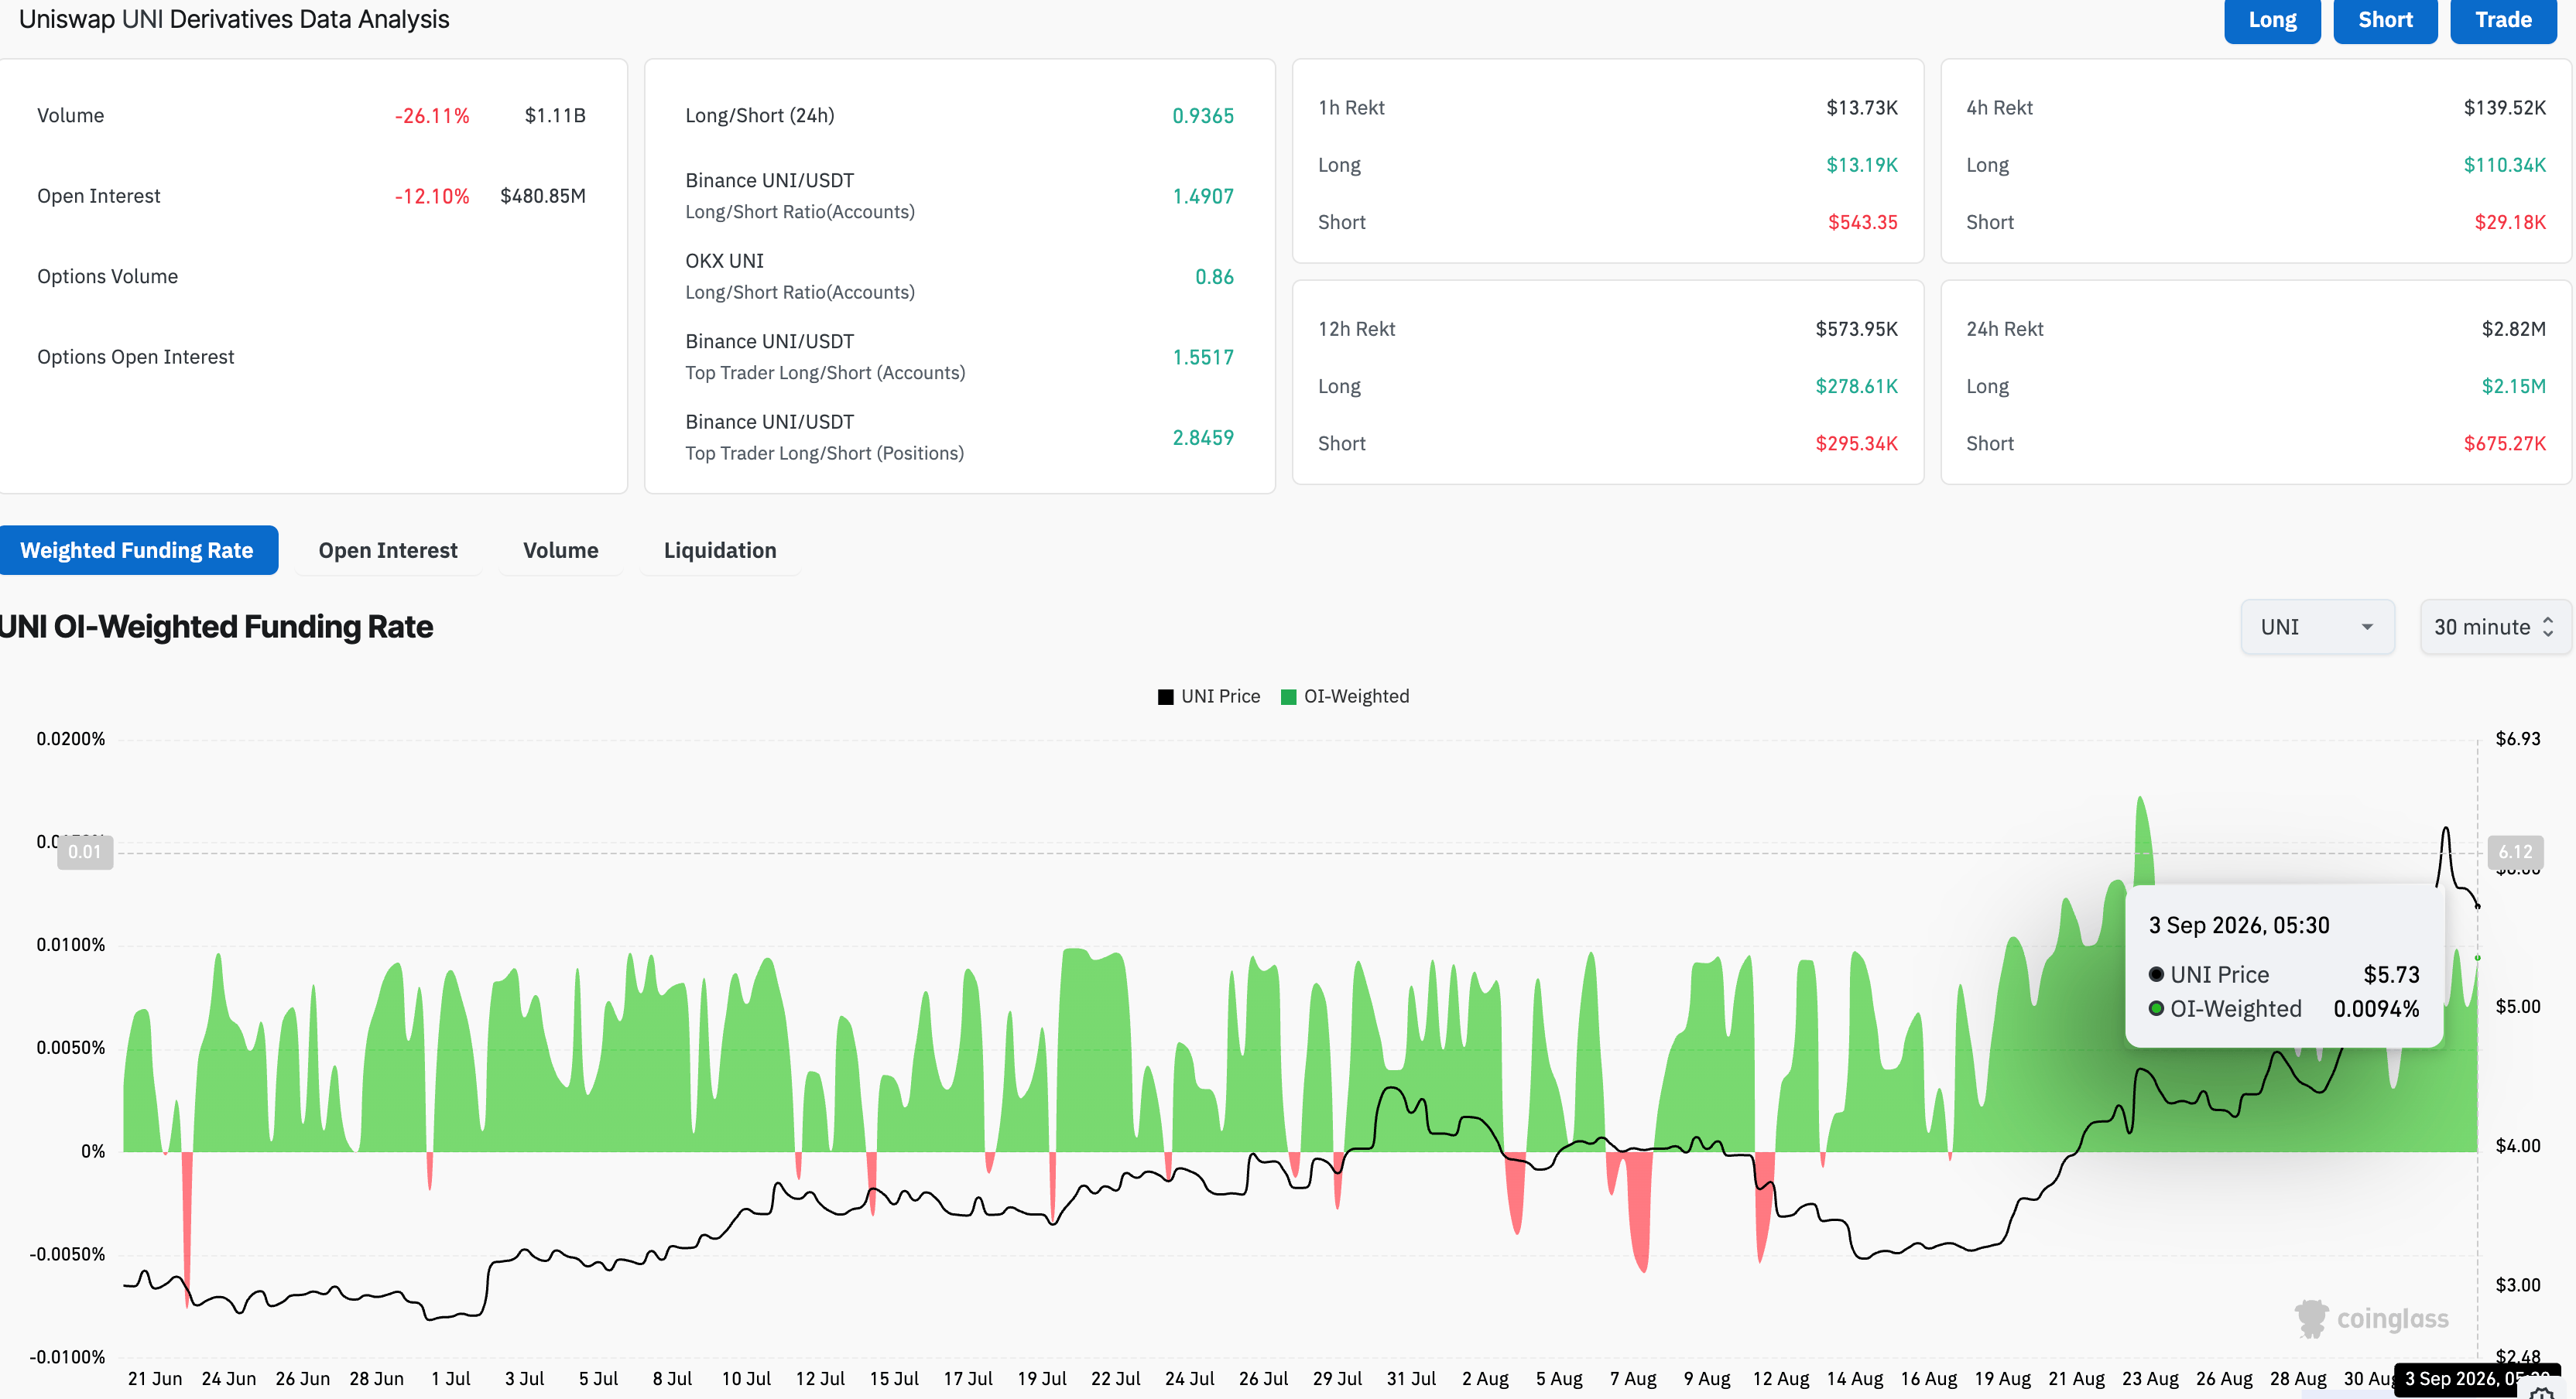
Uniswap derivatives data. Source: CoinGlass

Technical outlook: Will UNI rally extend above $6?

Uniswap trades around $5.73 at press time on Thursday, as price remains capped below the $6.00 threshold. Still, UNI maintains a bullish bias after a steady upward trend since August 15 and recording an annual high of $6.38 the previous day.

Uniswap holds well above the 50-day Exponential Moving Average (EMA) at $4.15, which crosses above the 200-day EMA at $3.98, marking a Golden Cross patten, which supports the uptrend and signals bullish trend reversal.

From a technical perspective, a confirmed breakout above the R1 Pivot Point at $6.09 could target the overhead R2 and R2 Pivot levels at $6.95 and $8.41, respectively. Momentum remains constructive on the daily chart, with the Moving Average Convergence Divergence (MACD) holding above its signal line, while the Relative Strength Index (RSI) at 74 flags overbought conditions.

Chart Analysis UNI/USDT (Binance)
UNI/USDT daily price chart.

On the downside, initial technical support is seen at the recent breakout area around the broken resistance trendline near $4.74, followed by the 50-day EMA at $4.15 where dip-buying interest could re-emerge if a pullback develops.

(The technical analysis of this story was written with the help of an AI tool. Know more.)

Disclaimer: For information purposes only. Past performance is not indicative of future results.
placeholder
XRP Price Prediction for July 2026: Can Buyers Finally Break the Downtrend?XRP (XRP) price trades near $1.05, caught between a year-long downtrend and a sudden burst of buying.July has historically rewarded XRP holders. This year the month arrives with on-chain accumulation
Author  Beincrypto
Jun 30, Tue
XRP (XRP) price trades near $1.05, caught between a year-long downtrend and a sudden burst of buying.July has historically rewarded XRP holders. This year the month arrives with on-chain accumulation
placeholder
XAUUSD Gold Analysis: Gold Holds Above $4,350 Ahead of US Inflation Data Is $4,500 Next? Gold holds above $4,350 following weak US jobs data. As inflation reports approach and UBS eyes $5,000, can XAUUSD break resistance at $4,435 to rally toward $4,500?
Author  Naoufal Seddik
Aug 12, Wed
Gold holds above $4,350 following weak US jobs data. As inflation reports approach and UBS eyes $5,000, can XAUUSD break resistance at $4,435 to rally toward $4,500?
placeholder
Gold Price Analysis Today: Gold Drops 1.32% Despite Lower Fed Rate-Hike Bets, Can $4,313 Support Hold? Gold fell 1.32% on August 13 after rising to $4,449.73, then reversing lower and closing near $4,349.918 below the $4,356.46 support. Softer US inflation data reduced Fed rate hike expectations, but selling pressure still dominated the session. Will $4,313 support hold?
Author  Naoufal Seddik
Aug 14, Fri
Gold fell 1.32% on August 13 after rising to $4,449.73, then reversing lower and closing near $4,349.918 below the $4,356.46 support. Softer US inflation data reduced Fed rate hike expectations, but selling pressure still dominated the session. Will $4,313 support hold?
placeholder
Gold Price Analysis Today: Gold Gains 0.94% as Markets Expect Fed to Hold Rates, Can $4,449 Resistance Break? Gold gained 0.94% on August 17, closing near $4,417.30 as softer US data strengthened expectations for unchanged Fed rates in September. Gold remains bullish, with $4,449.730 resistance and $4,310.650 support in focus.
Author  Naoufal Seddik
Aug 18, Tue
Gold gained 0.94% on August 17, closing near $4,417.30 as softer US data strengthened expectations for unchanged Fed rates in September. Gold remains bullish, with $4,449.730 resistance and $4,310.650 support in focus.
placeholder
Gold Price Analysis Today: Gold Rebounds After 1.91% Drop as Yields Ease. Is $4,449 Next? Gold fell about 1.91% on August 18 before producing a strong bullish reaction from the 1-hour demand zone in early August 19 trading. RSI is recovering from oversold conditions, but Supertrend remains bearish as traders await the Fed minutes.
Author  Naoufal Seddik
Aug 19, Wed
Gold fell about 1.91% on August 18 before producing a strong bullish reaction from the 1-hour demand zone in early August 19 trading. RSI is recovering from oversold conditions, but Supertrend remains bearish as traders await the Fed minutes.
Related Instrument
goTop
quote