


Dell Technologies Inc Stock (DELL) Moved Down by 4.11% on Sep 1: What Signal Does It Send?
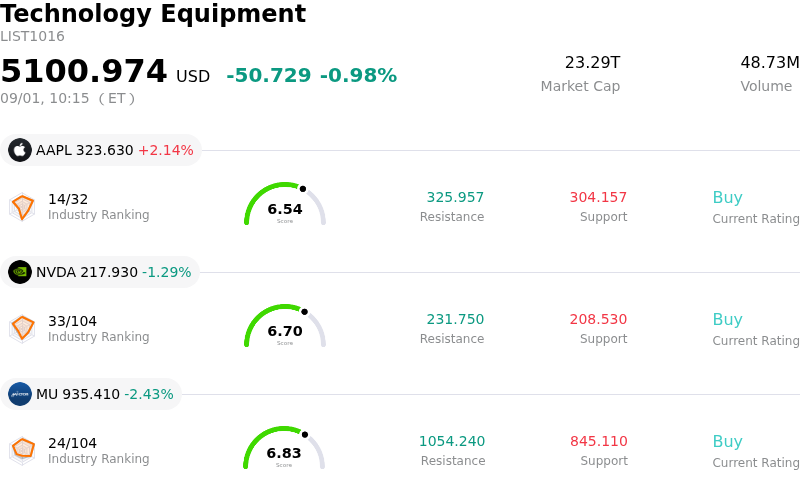
Dell Technologies Inc (DELL) moved down by 4.11%. The Technology Equipment sector is down by 0.98%. The company underperformed the industry. Top 3 stocks by turnover in the sector: Apple Inc (AAPL) up 2.08%; NVIDIA Corp (NVDA) down 1.29%; Micron Technology Inc (MU) down 2.40%.
What is driving Dell Technologies Inc (DELL)’s stock price down today?
Dell Technologies experienced noticeable downside pressure and intraday volatility as market participants engaged in pre-earnings de-risking and profit-taking ahead of the company's fiscal second-quarter financial results. Following an extensive multi-quarter rally driven by unprecedented enterprise demand for artificial intelligence infrastructure and server solutions, Wall Street expectations heading into the release have escalated to demanding levels. Options positioning indicated anticipation of a substantial post-earnings price move, prompting institutional traders to trim positions and lock in gains rather than hold unhedged exposure into the report.
Market sentiment was further tempered by ongoing scrutiny surrounding gross margin sustainability and rising input costs across the hardware sector. Recent commentary from industry peers pointed to margin pressures caused by elevated memory chip costs and higher supply chain expenses. While Dell continues to build a massive order backlog in its Infrastructure Solutions Group, investors are closely watching whether high-volume AI server shipments will compress overall profit margins, given the leaner profitability profile of server hardware deployment compared to enterprise software or traditional storage systems.
Valuation sensitivity also restricted buying interest during the trading session. The stock's rapid appreciation over the past year has elevated its price-to-earnings multiple well above historical medians, leaving little margin for error regarding management's upcoming forward guidance and backlog conversion execution. Compounded by broader macroeconomic caution across high-beta technology equities ahead of critical economic data and central bank policy updates, the pullback reflects a standard risk-off posture where elevated investor expectations and margin scrutiny temporarily outweighed long-term structural tailwinds in AI hardware.
Technical Analysis of Dell Technologies Inc (DELL)
Technically, Dell Technologies Inc (DELL) shows a MACD (12,26,9) value of -6.388, indicating a neutral signal. The RSI at 47.609 suggests neutral condition and the Williams %R at 85.439 suggests oversold condition. Please monitor closely.
Media Coverage of Dell Technologies Inc (DELL)
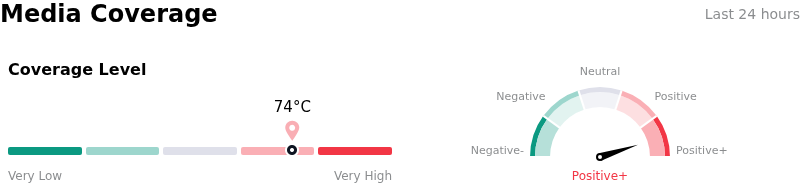
In terms of media coverage, Dell Technologies Inc (DELL) shows a coverage score of 74, indicating a high level of media attention. The overall market sentiment index is currently in extremely bullish zone.
Fundamental Analysis of Dell Technologies Inc (DELL)
Dell Technologies Inc (DELL) is in the Technology Equipment industry. Its latest annual revenue is $113.54B, ranking 2 in the industry. The net profit is $5.94B, ranking 4 in the industry. Company Profile
Over the past month, multiple analysts have rated the company as Buy, with an average price target of $503.78, a high of $700.00, and a low of $360.00.
More details about Dell Technologies Inc (DELL)
Company Specific Risks:
- Gross Margin Compression via Low-Margin AI Mix and Component Costs: Rapidly scaling AI-optimized server shipments carry significantly lower mid-single-digit operating margins compared to high-margin traditional storage units, while rising DRAM and NAND memory costs continue to pressure consolidated gross margins.
- Elevated Valuation and Asymmetric Earnings Volatility: Trading at a trailing P/E ratio far above its historical median following a strong year-to-date rally, the stock faces high downside risk ahead of its fiscal Q2 earnings release, where options markets are pricing an 11% intraday move if results fail to exceed heightened Street expectations.
- Hyperscaler Customer Concentration and Shift to ODM Models: Recent institutional commentary highlights risk tied to Dell's customer concentration among top AI infrastructure buyers, alongside competitive threats from rivals and client evaluations of direct Original Design Manufacturer (ODM) sourcing setups.
- Heavy Insider Divestment and Sponsor Liquidations: SEC filings and insider tracking indicate substantial equity liquidations totaling billions of dollars in Class C common stock by internal executives and financial sponsors without any offsetting insider share purchases.
Recommended Articles


