


Gold weakens below $4,400 as US Treasury yields surge, Fed rate hike bets rise
- Gold slides further on Tuesday after reversing from a more-than-three-month high last week.
- Hawkish Fed expectations and rising Treasury yields keep the precious metal under pressure.
- XAU/USD tests a key support zone as momentum shifts in favour of sellers.
Gold (XAU/USD) extends its pullback from the more-than-three-month high touched last week and falls to a fresh two-week low on Tuesday. Rising expectations of Federal Reserve (Fed) interest rate hikes and fresh tensions in the Middle East remain the main drivers behind the latest leg lower. At the time of writing, XAU/USD trades around $4,376, down roughly 1.60% on the day.
Following Fed Chair Kevin Warsh’s tough rhetoric on inflation at the Jackson Hole Symposium, interest rate hike bets are firmly back on the table. Traders now see the central bank raising borrowing costs as soon as this month, with the CME FedWatch Tool showing around a 65% probability of a hike at the September 15-16 meeting, up from roughly 40% a week ago.
The hawkish repricing helps the US Dollar (USD) recover some of its recent losses, while US Treasury yields resume their advance. The US Dollar Index (DXY), which tracks the Greenback against a basket of six major currencies, trades around 99.59, close to the two-week high of 99.72 touched on Friday. Meanwhile, the benchmark 10-year US Treasury yield rises to around 4.80%, its highest level since January 2025.
A firmer US Dollar makes Dollar-denominated Gold more expensive for overseas buyers, while higher Treasury yields increase the opportunity cost of holding the non-yielding metal.
At the same time, rising Oil prices are adding to inflation concerns and reinforcing expectations that worldwide central banks may need to keep monetary policy tight. West Texas Intermediate (WTI) Oil advances for the second consecutive day following the latest flare-up around the Strait of Hormuz.
The United States and Iran exchanged strikes for the first time in a month over the weekend, while a tanker was hit by three unidentified projectiles while sailing out of the strait, the United Kingdom Maritime Trade Operations (UKMTO) agency said on Tuesday.
Typically, inflation and geopolitical concerns support Gold. However, the market is currently reacting through the interest rate channel, and the metal tends to perform poorly when interest rates and Treasury yields rise.
Sellers are therefore likely to retain the upper hand in the near term, although upcoming US economic data and developments in the Middle East could trigger fresh volatility.
Tuesday’s US economic calendar features the August ISM Manufacturing Purchasing Managers Index (PMI) and July JOLTS Job Openings. Attention will then shift to the ADP Employment Change report on Wednesday and the closely watched Nonfarm Payrolls report on Friday.
Technical analysis: XAU/USD extends decline, eyes support near $4,350
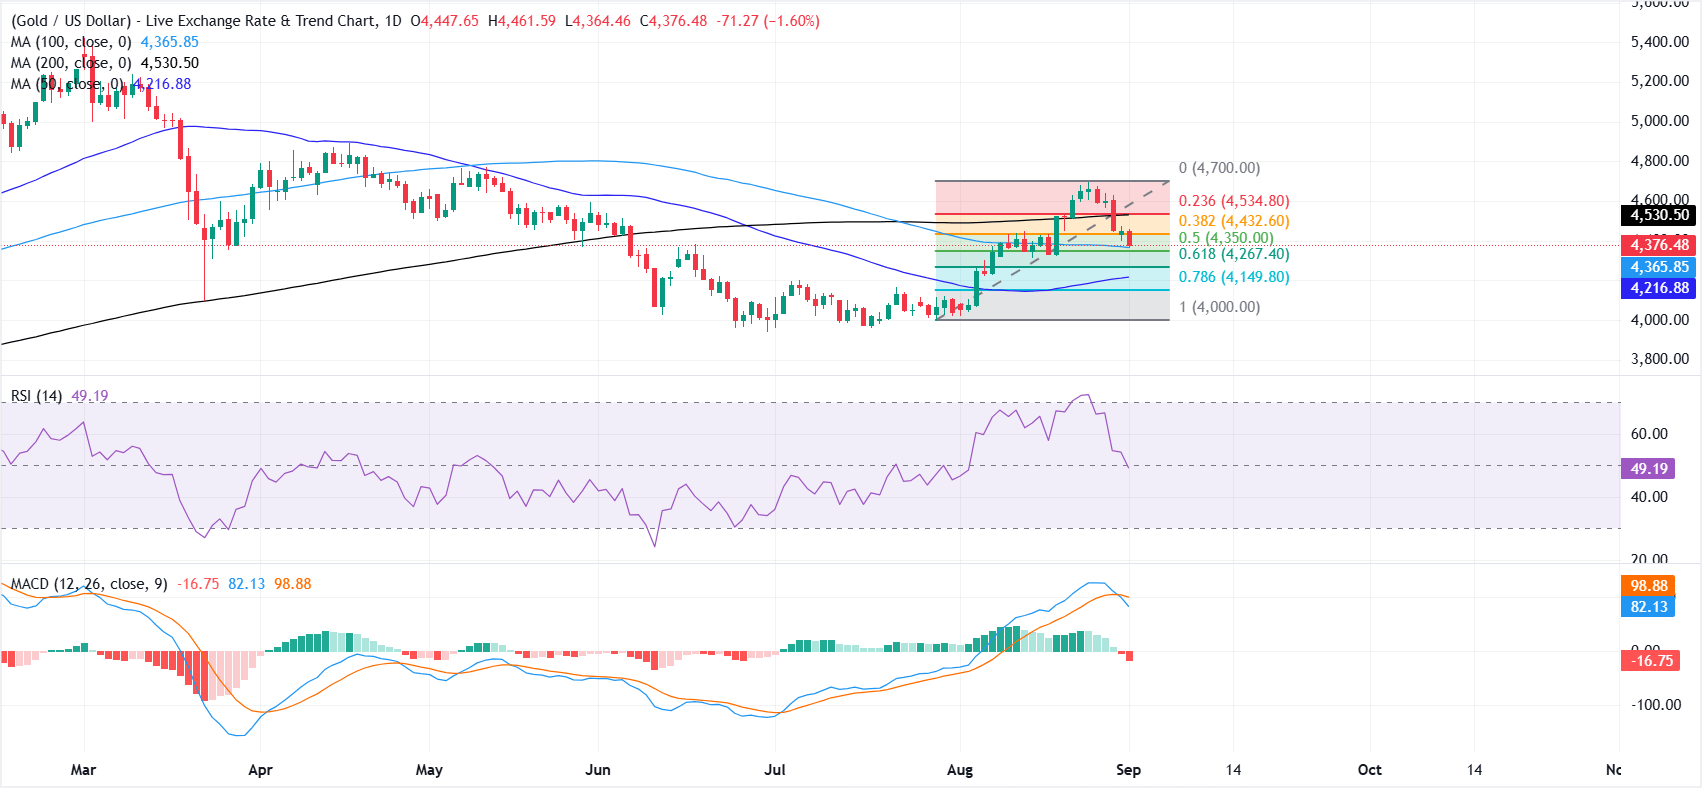
On the daily chart, XAU/USD extends its decline below the 200-day SMA and is now testing the 100-day SMA near $4,365, a level that also aligns closely with the 50% Fibonacci retracement at $4,350, forming a key support zone. A daily close below this cluster would tilt the near-term bias bearish, exposing the 61.8% retracement near $4,267.
The Relative Strength Index (RSI) at 49 sits near the midline, hinting at balanced conditions, while the Moving Average Convergence Divergence (MACD) indicator is in negative territory, suggesting waning bullish momentum after the recent pullback.
On the downside, a break below the $4,350-$4,365 support zone would open the door toward $4,267 (61.8% retracement), followed by $4,149 (78.6% retracement) and the prior cycle low near $4,000.
On the upside, initial resistance emerges at $4,432 (38.2% retracement), with a stronger barrier near $4,530 (200-day SMA) and $4,534 (23.6% retracement). A sustained break above this zone would open the path toward the $4,700 region.
(The technical analysis of this story was written with the help of an AI tool. Know more.)
Recommended Articles


