


Comfort Systems USA Inc Stock (FIX) Moved Down by 5.07% on Aug 28: What Signal Does It Send?
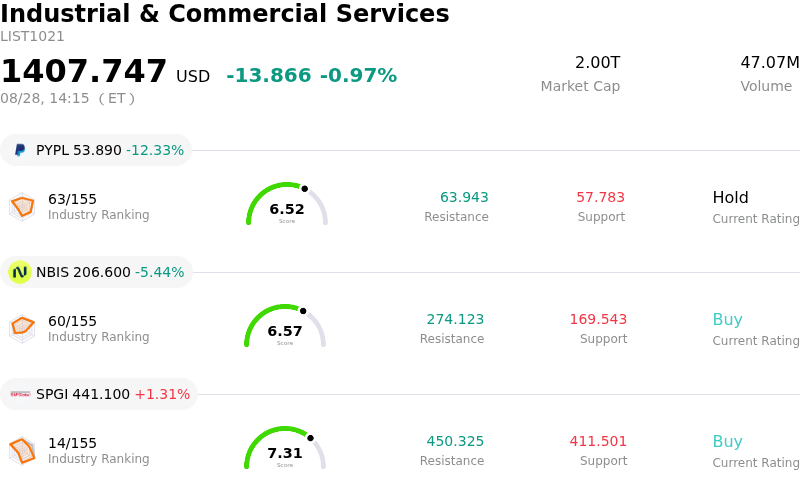
Comfort Systems USA Inc (FIX) moved down by 5.07%. The Industrial & Commercial Services sector is down by 0.97%. The company underperformed the industry. Top 3 stocks by turnover in the sector: PayPal Holdings Inc (PYPL) down 12.33%; Nebius Group NV (NBIS) down 5.46%; S&P Global Inc (SPGI) up 1.31%.
What is driving Comfort Systems USA Inc (FIX)’s stock price down today?
Comfort Systems USA experienced downside pressure driven primarily by profit-taking following recent corporate insider activity and extended valuation metrics. A regulatory filing disclosed that Chief Executive Officer Brian Lane sold a portion of his direct holdings, liquidating tens of millions of dollars in stock outside of a pre-scheduled trading plan. Although executive stock sales occur for various personal liquidity reasons, open-market disinvestments by key leadership often act as a catalyst for retail and institutional investors to lock in gains, particularly after an extended multi-quarter rally.
The selling pressure was further amplified by mounting market focus on the stock's rich valuation multiple relative to historical averages and industrial sector peers. Following a substantial run-up fueled by booming demand for artificial intelligence data center infrastructure and modular construction services, the company's valuation metrics had stretched well above historical standards. As broader equity markets contended with firm Treasury yields and a tactical rotation away from high-multiple momentum stocks, investors increasingly scrutinized concentration risks and near-term execution hurdles, prompting a pullback across AI-linked engineering and construction equities.
Despite the immediate weakness in sentiment, the company's operational backdrop remains exceptionally robust. Comfort Systems continues to leverage unprecedented demand for HVAC and electrical contracting services across the technology sector, supported by double-digit organic growth and a record-high project backlog. While Wall Street research analysts maintain generally bullish price targets and positive ratings based on durable medium-term trends in data center build-outs, near-term price action reflects a market rebalancing as investors digest executive sales and normalize inflated valuation multiples.
Technical Analysis of Comfort Systems USA Inc (FIX)
Technically, Comfort Systems USA Inc (FIX) shows a MACD (12,26,9) value of -31.610, indicating a sell signal. The RSI at 37.736 suggests neutral condition and the Williams %R at 99.955 suggests oversold condition. Please monitor closely.
Media Coverage of Comfort Systems USA Inc (FIX)
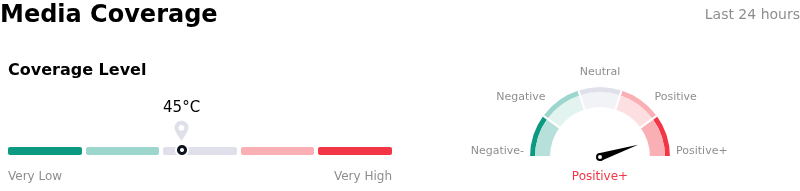
In terms of media coverage, Comfort Systems USA Inc (FIX) shows a coverage score of 45, indicating a moderate level of media attention. The overall market sentiment index is currently in extremely bullish zone.
Fundamental Analysis of Comfort Systems USA Inc (FIX)
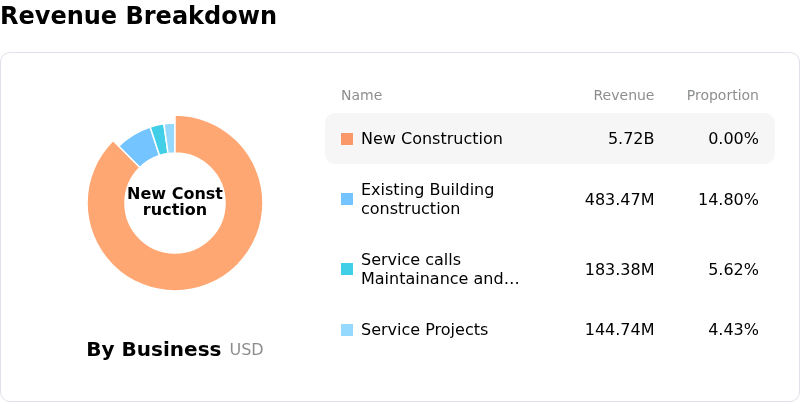
Comfort Systems USA Inc (FIX) is in the Industrial & Commercial Services industry. Its latest annual revenue is $0.00, ranking 64 in the industry. The net profit is $370.38M, ranking 7 in the industry. Company Profile
Over the past month, multiple analysts have rated the company as Buy, with an average price target of $2164.14, a high of $2500.00, and a low of $1800.45.
More details about Comfort Systems USA Inc (FIX)
Company Specific Risks:
- Peak Margin and Growth Expectations: Analyst commentary highlights that the company's EBITDA margin expansion and rapid revenue acceleration are projected to peak in 2026, driving concerns over decelerating growth in 2027 and prompting aggressive institutional profit-taking.
- Valuation Premium and Multiple Compression: Trading at a trailing price-to-earnings ratio near 39x—well above its 5-year historical median of 25.9x—the stock exhibits an unbuffered valuation premium, leaving it highly vulnerable to intraday sell-offs and technical de-rating.
- High End-Market Concentration in Data Center Infrastructure: Revenue and backlog expansion are heavily reliant on large-scale AI data center construction, exposing the business model to severe execution and demand risks if technology hyperscalers delay capital expenditures or reduce project scope.
- Labor Capacity Bottlenecks and Insider Selling: Execution of the record $14 billion backlog faces physical capacity constraints in skilled trade labor and prefabrication facilities, while over $150 million in insider sales over the past year with zero insider buying undermines market sentiment.
Recommended Articles


