


The Canadian Dollar falls on the best quarter since 2023
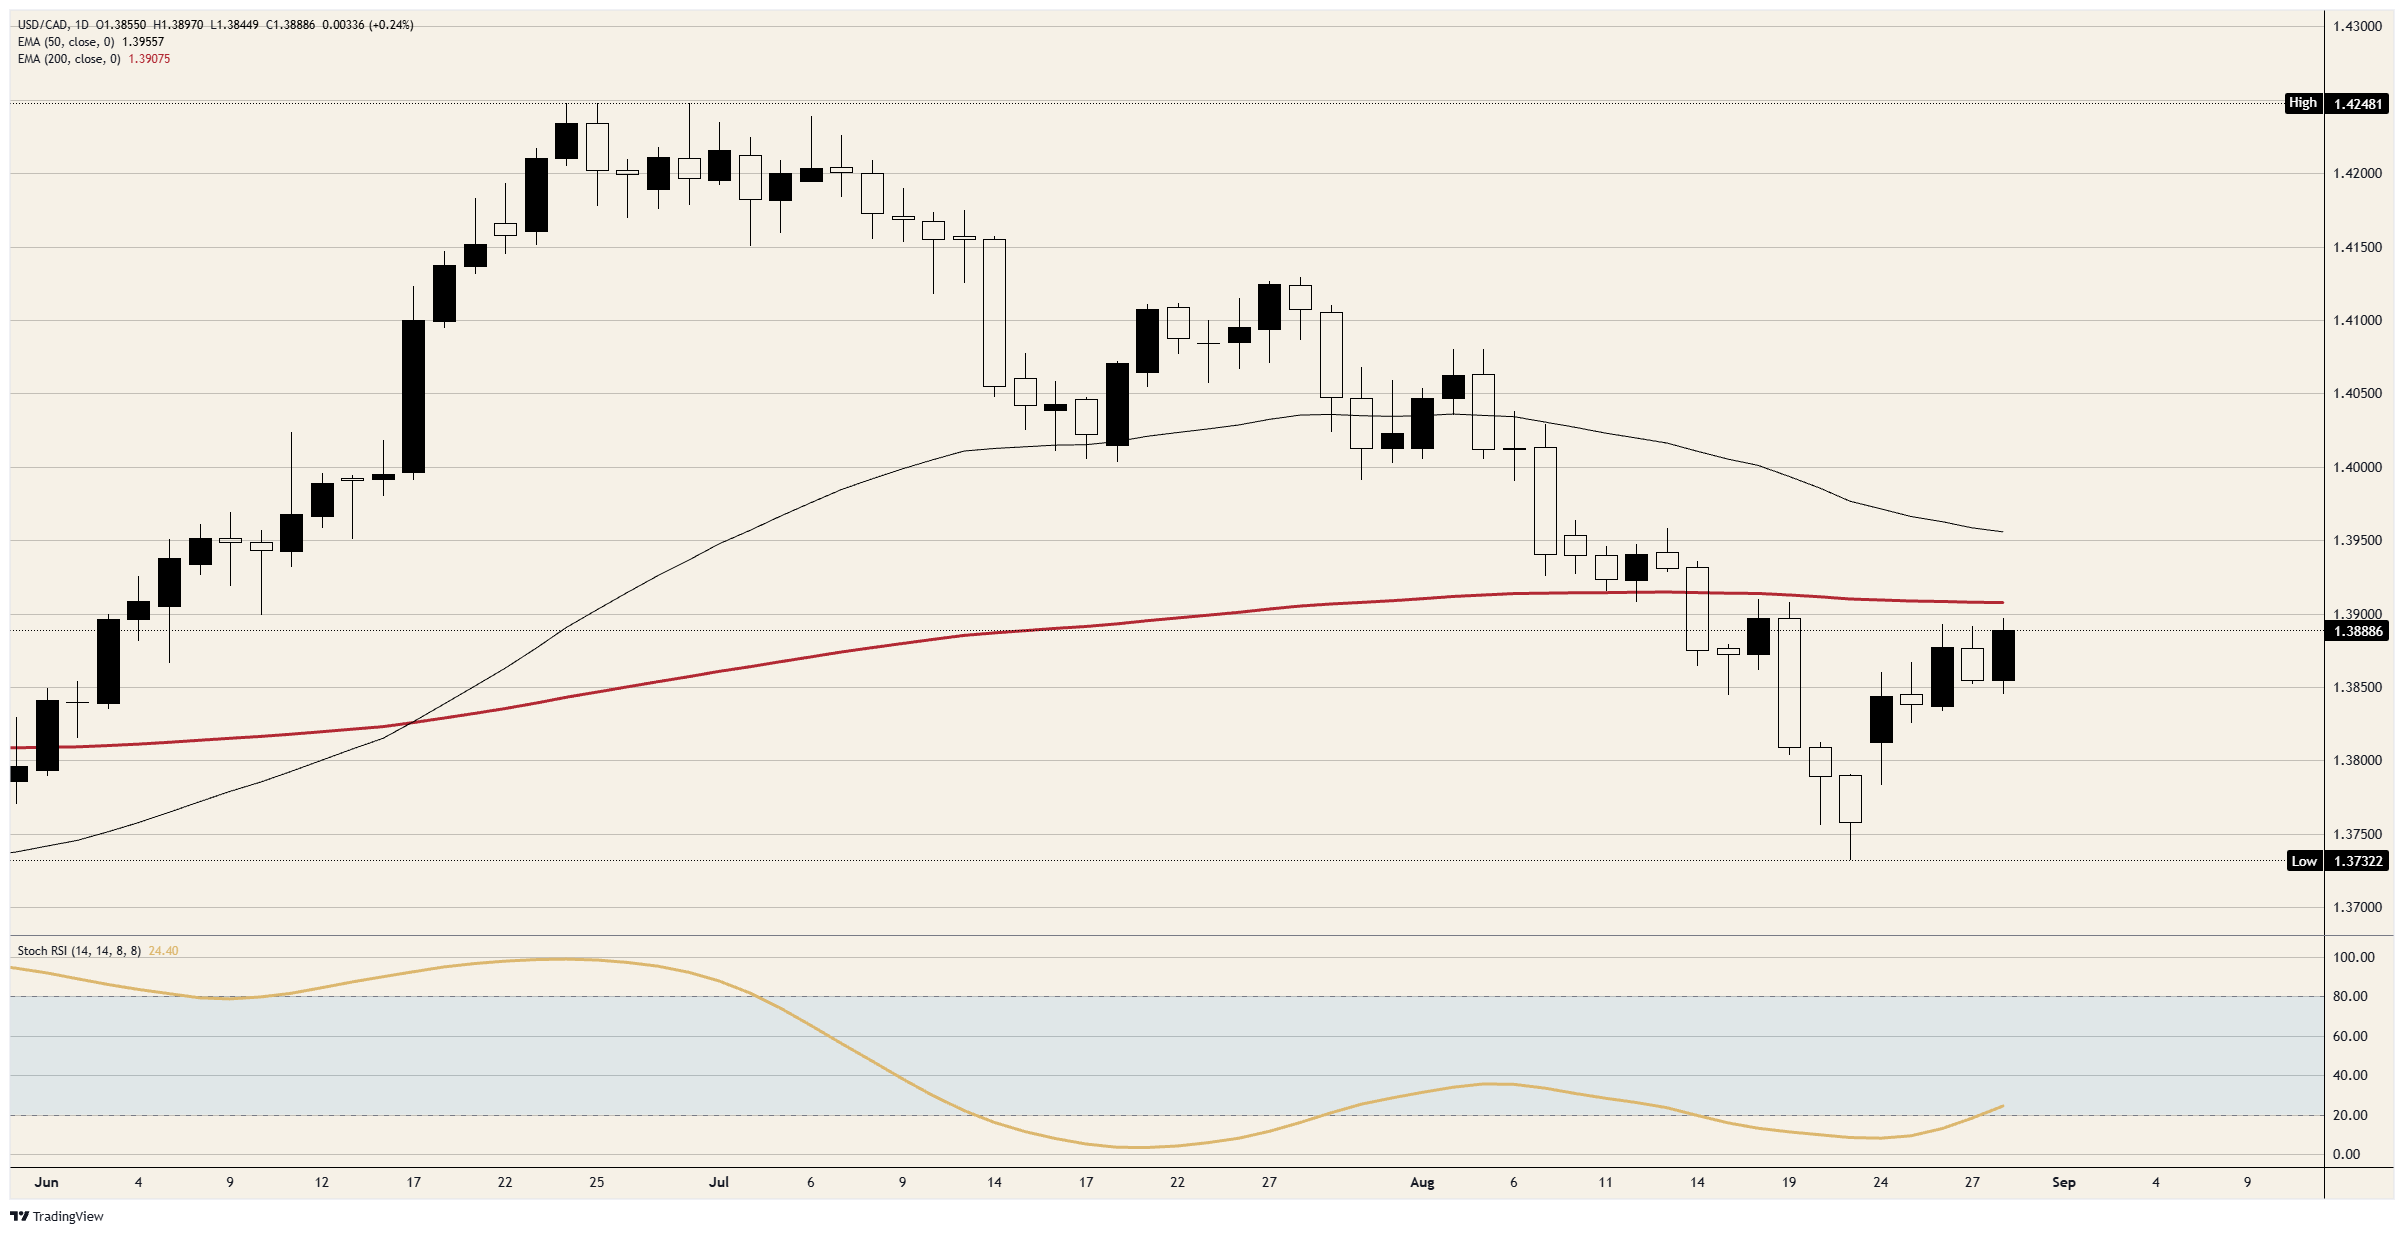
- USD/CAD trades just beneath 1.3900, up 0.24%, capped by the 200-day EMA.
- Canada grew 3.3% annualized in the second quarter, the fastest since early 2023.
- Futures price a September Fed hike above 55%, from even odds on August 10.
Canada produced the strongest growth figure of the cycle and the Canadian Dollar is weaker for it. Gross Domestic Product (GDP) rose 3.3% annualized in the second quarter, the fastest pace since early 2023 and comfortably above the 2.5% the Bank of Canada had forecast, while a revision to the first quarter erased the technical recession that had framed every rate discussion in Ottawa since May. USD/CAD trades just beneath 1.3900 regardless.
A quarter that ended before the tariff arrived
The composition of the report is stronger than the modest headline miss against a 3.4% consensus suggests. Exports rose 3.6% on the quarter, the largest increase in three years, led by a 27% jump in shipments of passenger cars and light trucks as domestic auto production recovered from two quarters of decline. Business capital investment rose 2.3% and broke a five-quarter losing streak, and June activity added 0.3% against a 0.2% forecast.
None of it describes the economy currently trading. The quarter ended June 30, seven weeks before a 50% American duty landed on roughly C$27.6 billion of Canadian goods on August 22, and before Ottawa's matching measures take effect September 8. Statistics Canada already has July output flat and expects manufacturing to have given ground back. The single line that carried the rebound is autos, and Washington has threatened to tax cars, trucks, parts and steel at 50% from January 1.
The gap widened from one side only
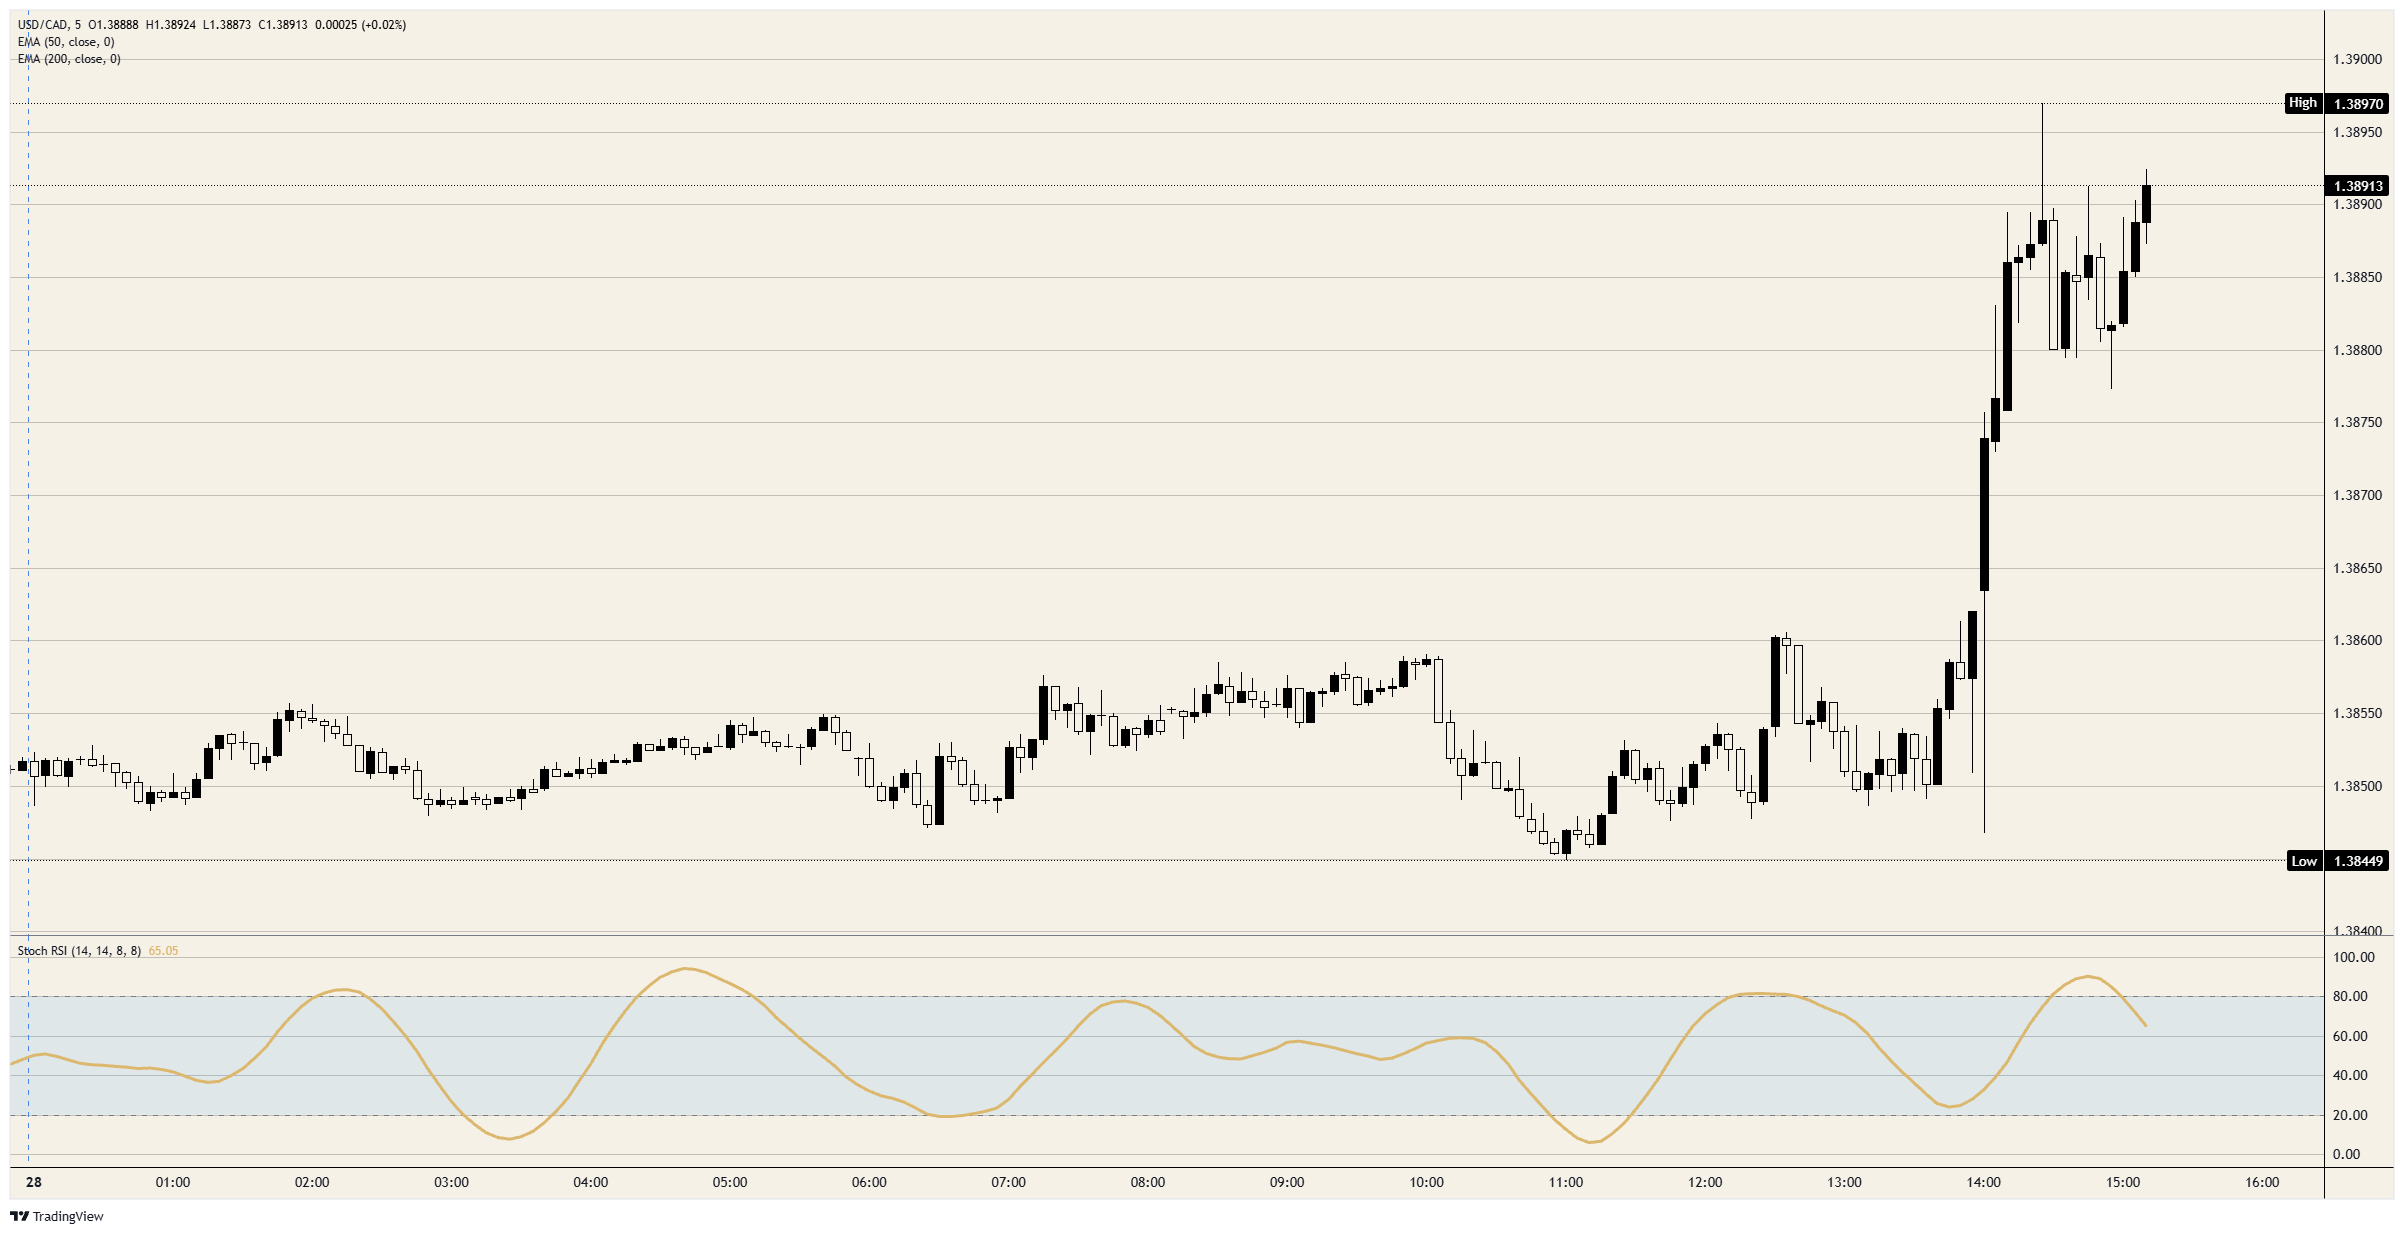
The move on the day came from Wyoming rather than Ottawa. The Federal Reserve chair used his first Jackson Hole keynote to warn that the committee still has work ahead of it while it lacks confidence that underlying inflation is returning to 2%, the closest he has come to conceding that higher rates may be needed. Two-year Treasury yields pushed to a one-month high and USD/CAD added roughly 50 pips inside half an hour of the 14:00 GMT remarks.
Futures now put a quarter-point increase at the September 16 meeting above 55%, the first time the tightening side has carried a meeting outright, against an even split on August 10. At least one increase runs near 85% by October 28, and by December 9 the current range prices at zero with a second increase at roughly 38%. The Bank of Canada meets first, on September 2, and is priced for another hold with a hike in single digits.
The asymmetry between the two sides is the entire trade, because the Canadian Dollar has never followed the posted spread between the two policy rates, which has barely moved all year, but the expected one. Today that expected spread widened without a single Canadian input touching it. A country printing its fastest growth in three years still lost ground, because only one of the two central banks repriced.
Three releases, one trade
Two of the three American prints timed for 14:00 GMT argued the other way. The final August University of Michigan survey revised sentiment up to 51.7 from 51.0, with the expectations index at 51.5 against a 50.6 preliminary reading, and year-ahead inflation expectations fell to 4.0% from 4.2% in July. The five-year measure held at 3.3% for a third consecutive month.
The annual benchmark revision to payrolls subtracted jobs again in the same minute, against a consensus looking for the first upward adjustment since 2022 at close to 200K. Cooling inflation expectations and a weaker labour benchmark both lost to a single paragraph from a podium. Traders took the price-stability half of the mandate and discarded the employment half, which is the cleanest read yet on how this chair weighs the two.
What the next week decides
The Bank of Canada announces September 2 and American payrolls follow September 4, so the divergence priced today is tested twice inside a week. Canadian inflation ran at 3.0% in July, held up by fuel costs that the Gulf supply disruption keeps elevated, which is why a tariff shock to growth does not automatically buy a cut. The counter-tariffs then arrive September 8, and the quarter that reads best in three years starts being replaced by one that will not.
Levels to watch
Resistance: Sellers turned the advance back at the 200-day Exponential Moving Average (EMA) near 1.3900, which sits on the handle of the same name and marks the first gate. The 50-day EMA near 1.3950 is declining above it, and the 1.4000 handle caps the recovery beyond that.
Support: The session floor lies in the 1.3850 area, with 1.3800 the next shelf beneath it. Below there the August base just under 1.3750 is the low of the summer range and the level any renewed Canadian Dollar bid has to take out.
Bias: Bullish while 1.3850 holds, with the daily Stochastic Relative Strength Index (Stoch RSI) near 24 turning up out of the oversold band. A daily close above 1.3900 opens 1.3950 and then the 1.4000 handle. Invalidation on a daily close beneath 1.3800.
USD/CAD 5-minute chart
USD/CAD daily chart
Canadian Dollar FAQs
The key factors driving the Canadian Dollar (CAD) are the level of interest rates set by the Bank of Canada (BoC), the price of Oil, Canada’s largest export, the health of its economy, inflation and the Trade Balance, which is the difference between the value of Canada’s exports versus its imports. Other factors include market sentiment – whether investors are taking on more risky assets (risk-on) or seeking safe-havens (risk-off) – with risk-on being CAD-positive. As its largest trading partner, the health of the US economy is also a key factor influencing the Canadian Dollar.
The Bank of Canada (BoC) has a significant influence on the Canadian Dollar by setting the level of interest rates that banks can lend to one another. This influences the level of interest rates for everyone. The main goal of the BoC is to maintain inflation at 1-3% by adjusting interest rates up or down. Relatively higher interest rates tend to be positive for the CAD. The Bank of Canada can also use quantitative easing and tightening to influence credit conditions, with the former CAD-negative and the latter CAD-positive.
The price of Oil is a key factor impacting the value of the Canadian Dollar. Petroleum is Canada’s biggest export, so Oil price tends to have an immediate impact on the CAD value. Generally, if Oil price rises CAD also goes up, as aggregate demand for the currency increases. The opposite is the case if the price of Oil falls. Higher Oil prices also tend to result in a greater likelihood of a positive Trade Balance, which is also supportive of the CAD.
While inflation had always traditionally been thought of as a negative factor for a currency since it lowers the value of money, the opposite has actually been the case in modern times with the relaxation of cross-border capital controls. Higher inflation tends to lead central banks to put up interest rates which attracts more capital inflows from global investors seeking a lucrative place to keep their money. This increases demand for the local currency, which in Canada’s case is the Canadian Dollar.
Macroeconomic data releases gauge the health of the economy and can have an impact on the Canadian Dollar. Indicators such as GDP, Manufacturing and Services PMIs, employment, and consumer sentiment surveys can all influence the direction of the CAD. A strong economy is good for the Canadian Dollar. Not only does it attract more foreign investment but it may encourage the Bank of Canada to put up interest rates, leading to a stronger currency. If economic data is weak, however, the CAD is likely to fall.
Recommended Articles


