


KLA Corp Stock (KLAC) Moved Down by 3.84% on Aug 24: A Full Analysis
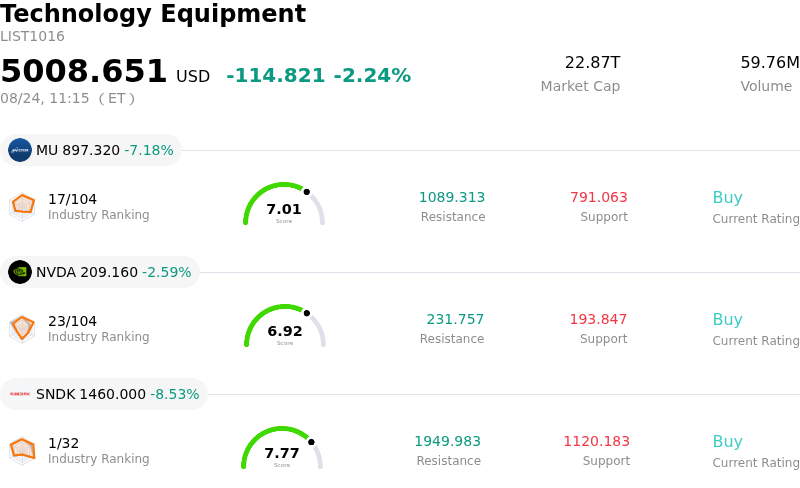
KLA Corp (KLAC) moved down by 3.84%. The Technology Equipment sector is down by 2.24%. The company underperformed the industry. Top 3 stocks by turnover in the sector: Micron Technology Inc (MU) down 7.23%; NVIDIA Corp (NVDA) down 2.59%; SanDisk Corporation (SNDK) down 8.53%.
What is driving KLA Corp (KLAC)’s stock price down today?
KLA Corporation experienced downward pressure and heightened intraday volatility as part of a broader sell-off across semiconductor capital equipment stocks. Investors have increasingly focused on the sustainability and timing of artificial intelligence capital expenditures by major cloud hyperscalers. Concerns over off-balance-sheet commitments and near-term returns on investment in AI infrastructure prompted institutional profit-taking across the picks-and-shovels segment of the chip manufacturing supply chain, impacting semiconductor process control and wafer inspection equipment providers alongside their industry peers.
The pull-back also reflects a valuation recalibration following a period of significant sector outperformance. Having surged substantially over recent quarters, intrinsic value models and discounted cash flow analyses began highlighting elevated multiples relative to historical averages. This stretched valuation profile rendered the stock particularly sensitive to shifts in market sentiment, prompting institutional investors and asset managers to lock in profits and rebalance tech exposure during a broader de-risking phase.
Macroeconomic headwinds, including volatility in long-term Treasury yields and persistent geopolitical friction, further dampened risk appetite for high-multiple technology equities. Despite these short-term trading dynamics, the company's underlying operational foundation remains bolstered by strong quarterly financial execution and upbeat forward guidance driven by chip manufacturing complexity, advanced packaging architectures, and leading-edge semiconductor nodes. However, ongoing sector rotation and macro-level uncertainty continue to dominate near-term price action.
Technical Analysis of KLA Corp (KLAC)
Technically, KLA Corp (KLAC) shows a MACD (12,26,9) value of -1.714, indicating a sell signal. The RSI at 36.909 suggests neutral condition and the Williams %R at 98.005 suggests oversold condition. Please monitor closely.
Media Coverage of KLA Corp (KLAC)
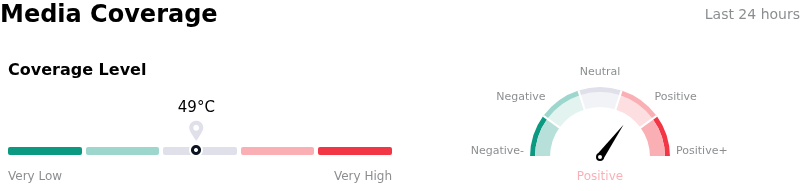
In terms of media coverage, KLA Corp (KLAC) shows a coverage score of 49, indicating a moderate level of media attention. The overall market sentiment index is currently in bullish zone.
Fundamental Analysis of KLA Corp (KLAC)
KLA Corp (KLAC) is in the Technology Equipment industry. Its latest annual revenue is $13.58B, ranking 15 in the industry. The net profit is $4.83B, ranking 11 in the industry. Company Profile
Over the past month, multiple analysts have rated the company as Buy, with an average price target of $229.87, a high of $325.00, and a low of $138.80.
More details about KLA Corp (KLAC)
Company Specific Risks:
- Elevated Valuation Multiple Vulnerability: KLA Corporation trades at a price-to-earnings multiple exceeding 50x, placing its valuation at a substantial premium over historical medians and intrinsic fair value estimates, which exposes the stock to sharp intraday pullbacks during semiconductor sector profit-taking.
- China Exposure and Geopolitical Regulatory Risks: Wall Street analysts consistently flag KLA's heavy revenue reliance on mainland China, leaving the business vulnerable to tightening semiconductor export controls, potential tariff headwinds, and delayed equipment move-ins by foreign fabs.
- Gross Margin Compression and Limited Guidance Upside: Recent financial guidance and analyst commentaries highlight near-term gross margin contraction and limited upside relative to elevated market expectations, creating Execution risk if cost pressures linger.
- Insider Liquidation Activity and Cash Flow Pressure: SEC filings and insider reporting show significant executive share sales totaling over $118 million past-year with zero insider purchases, occurring alongside a deceleration in operating cash flows and free cash flow generation relative to the firm's valuation.
Recommended Articles


