


Solana (SOLUSD) Volatility Intensified on Aug 22: What You Should Know
Solana (SOLUSD) is up 5.44% at Aug 22 00:10(ET), now at $95.81, with a 7-day up of 28.54%.
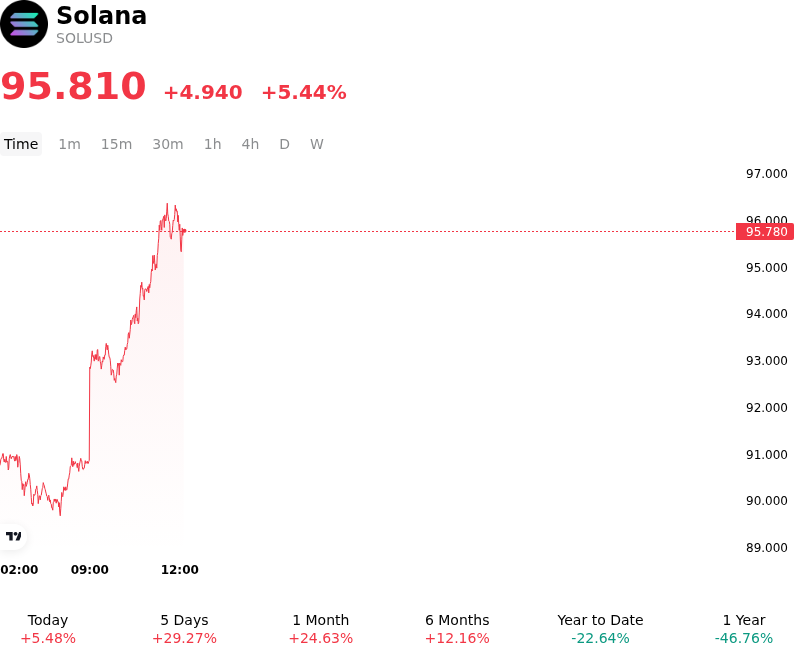
What is driving Solana (SOLUSD)’s stock price up today?
Capital flowed into Solana as a combination of macro liquidity easing and derivative market mechanics galvanized risk appetite across digital asset markets. An unexpected expansion in U.S. Treasury bond buyback operations exerted downward pressure on long-dated yields, effectively injecting liquidity into the broader financial system and dampening U.S. dollar strength. This macro easing environment catalyzed a broad-based crypto rally, triggering a wave of short liquidations across digital asset derivatives. As leveraged short positions were forcibly unwound, the resulting buy-side momentum accelerated gains in high-beta Layer-1 assets, with Solana absorbing substantial capital inflows.
Institutional participation via U.S. spot Solana exchange-traded funds provided a strong fundamental backstop to the advance. Spot ETF products registered a marked acceleration in net inflows, signaling renewed institutional demand and steady portfolio allocation into leading smart contract platforms. This sustained ETF inflow absorbed circulating spot supply, improving liquidity conditions and boosting spot market order book dynamics. Furthermore, ongoing legislative discussions in Washington surrounding digital asset market structure provided a supportive regulatory narrative, boosting long-term adoption expectations for compliant blockchain infrastructure.
Network-specific technical upgrades and expanding on-chain activity supplied additional tailwinds. The mainnet activation of the Agave core upgrade reduced target slot times and expanded transaction execution limits, advancing Solana's throughput roadmap and strengthening its competitive positioning against rival Layer-1 ecosystems. On-chain data also highlighted accelerating institutional engagement in Real-World Asset (RWA) tokenization and decentralized finance protocols, with major asset managers deploying tokenized credit funds onto the network. The convergence of favorable macro liquidity, spot ETF buying, derivative short covering, and solid network fundamentals successfully drove the upward repricing.
Technical Analysis of Solana (SOLUSD)
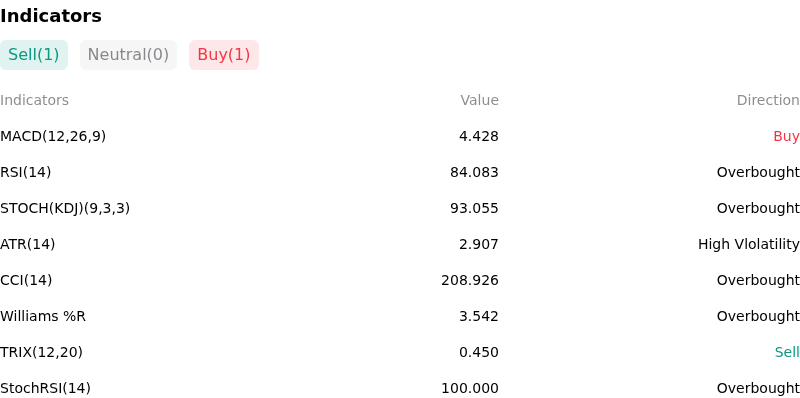
Technically, Solana (SOLUSD) shows a MACD (12,26,9) value of 4.428, indicating a buy signal. The RSI at 84.083 suggests overbought condition and the Williams %R at 3.542 suggests overbought condition. Please monitor closely.
More details about Solana (SOLUSD)
Recent Events and Risks:
- Overbought Technicals and Heavy Overhead Resistance: Following a rapid weekly surge toward $93–$94, SOL's daily Relative Strength Index (RSI) reached overbought levels above 81, leaving price vulnerable to aggressive profit-taking and mean-reversion as it approaches a major historical supply wall in the $95–$100 zone.
- Elevated Derivatives Leverage and Long Liquidation Exposure: Aggressive positioning following recent short squeezes drove Solana futures open interest to $5.66 billion and daily derivatives volume to $13.7 billion, creating a heavily leveraged, long-biased market structure vulnerable to cascade liquidations down toward $88–$80 support if $95 resistance caps upside.
- Mechanical Squeeze Reliance Without Sustained Spot Buying: Recent intraday price expansion was predominantly propelled by $41 million in forced SOL short liquidations and macro-driven short covering, rather than organic spot market accumulation, leaving the asset exposed to sharp downside retracements if derivatives momentum stalls.
- Mainnet Upgrade Execution and Validator Operational Risks: Core network changes—such as lowering mainnet slot target times to 350ms around Epoch 1020 alongside active validator proposals regarding daily token burn adjustments—introduce technical execution risks, where any node desynchronization or RPC congestion under heavy volume could disrupt market confidence.
Recommended Articles


