


Ethereum (ETHUSD) Is up 1.49% on Aug 20: Here Is Why
Ethereum (ETHUSD) is up 1.49% at Aug 20 00:00(ET), now at $2248.71, with a 7-day up of 19.36%.
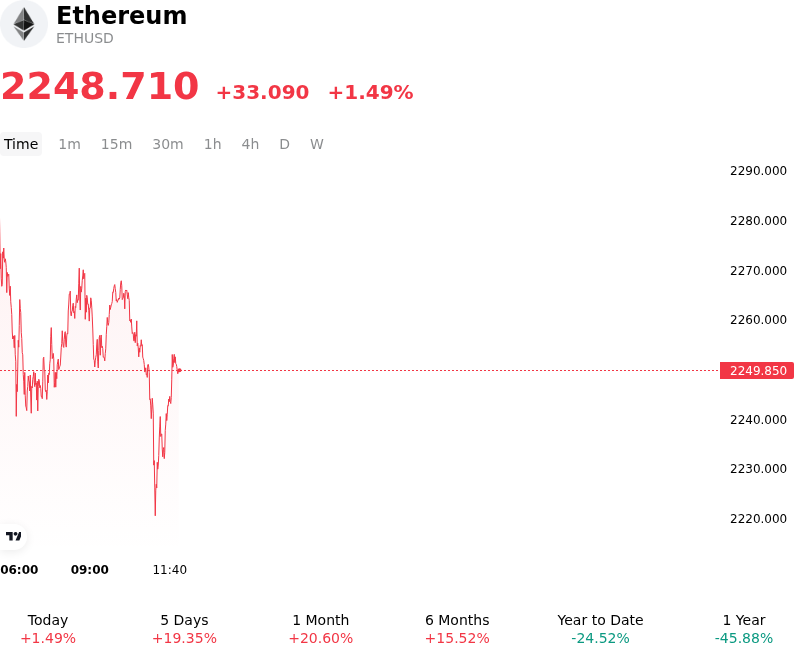
What is driving Ethereum (ETHUSD)’s stock price up today?
The advance in Ethereum reflected a confluence of easing macroeconomic headwinds, renewed institutional capital flows, and favorable derivatives positioning. Capital appetite for digital assets was bolstered by a broader risk-on shift across global markets following US Treasury policy measures aimed at expanding liquidity support through bond buyback operations. The resulting decline in benchmark Treasury yields and subsequent softness in the US dollar reduced real yields, easing global financial conditions and encouraging institutional allocators to rotate into higher-beta digital assets.
Institutional participation through spot Ethereum ETFs provided a crucial structural tailwind, extending a trend of positive net inflows driven by major fund issuers. Persistent demand for spot ETF products underscores rebuilding institutional confidence, particularly as staking-enabled investment vehicles and corporate treasury accumulation turn Ether exposure into a yield-generating capital asset. This sustained spot buying helped absorb order-book liquidity, lifting prices past key resistance levels and short-term moving average technical barriers.
Ecosystem developments and layer-2 activity also reinforced positive sentiment. Progress toward scheduled network protocol upgrades, coupled with expanding fintech integration that broadens direct retail and institutional entry points, strengthened adoption expectations. In the derivatives market, the upward breakout triggered short-covering activity and the liquidation of crowded short positions, generating secondary spot-buying pressure.
While macro liquidity conditions and institutional fund flows favor near-term price stabilization, market participants continue to monitor key risks. The ongoing migration of transaction execution to Layer-2 rollups continues to depress mainnet gas fees and burn rates, which could temper the structural supply-reduction narrative over time. Additionally, investors remain attentive to upcoming Federal Reserve policy communication and potential shifts in broader global risk appetite to gauge the long-term sustainability of capital inflows.
Technical Analysis of Ethereum (ETHUSD)
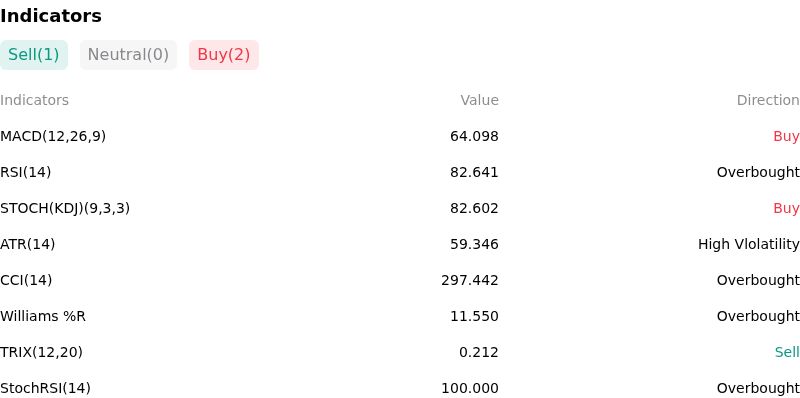
Technically, Ethereum (ETHUSD) shows a MACD (12,26,9) value of 64.098, indicating a buy signal. The RSI at 82.641 suggests overbought condition and the Williams %R at 11.550 suggests overbought condition. Please monitor closely.
More details about Ethereum (ETHUSD)
Recent Events and Risks:
- Institutional ETF Redemptions: U.S. spot Ethereum ETFs recorded a reversal to net weekly outflows totaling $2.26 million, led by redemptions in BlackRock's ETHA and Fidelity's FETH, underscoring institutional demand fatigue and dampening buying momentum.
- Whale Distribution and Exchange Inflows: On-chain tracking reveals persistent sell-side pressure as dormant whale wallets and large holders transfer thousands of ETH to centralized exchanges and OTC desks, adding substantial overhead supply.
- Derivatives Leverage and Liquidation Risk: Intraday price rallies toward the $1,920–$1,930 resistance range continue to face rejection, leaving dense clusters of leveraged long positions between $1,850 and $1,870 vulnerable to potential liquidation cascades.
- Subdued Spot Demand Metrics: Market structure indicators signal weak spot accumulation, underscored by a negative Coinbase Premium Index and contracting decentralized exchange trading volumes, reflecting muted U.S. institutional spot appetite.
Recommended Articles


