


Bitcoin Price Prediction: BTC Surges to Hit $70,000 Mark, Could Soar Another 17%
TradingKey - On August 20, Bitcoin (BTC) rallied strongly to touch the key $70,000 level, hitting a new high since February this year. Over the past 24 hours, Bitcoin's price surged over 8%, marking its largest single-day gain since March this year. Currently, Bitcoin's price has experienced a brief pullback, trading at $69,453. So, why did Bitcoin prices rise today? Can the rally continue?
Why Is Bitcoin Price Rising?
The most critical factor driving this round of Bitcoin's price surge is the U.S. Department of the Treasury's announcement to more than double the scale of government bond buybacks, raising the single-operation cap from the original $2 billion to at least $4 billion. This move, which directly pushed down U.S. Treasury yields and weighed on the U.S. Dollar Index (DXY), is equivalent to injecting actual liquidity into the market, providing a major boost to liquidity-sensitive risk assets such as Bitcoin.
Secondly, U.S. President Donald Trump released multiple positive developments for crypto, including meeting with executives from several U.S. crypto giants such as Coinbase, Kraken, and Blockchain.com, once again urging Congress to pass the Clarity Act, and revealing the latest plans for a U.S. strategic cryptocurrency reserve, significantly boosting market optimism regarding future regulatory policy developments.
These positive developments directly drove over $500 million in net inflows into U.S. spot Bitcoin ETFs yesterday, reaching a new high since May this year and triggering massive forced liquidations in the derivatives market. Over the past 24 hours, short liquidations across the entire crypto market exceeded $2.7 billion, with Bitcoin short positions accounting for over $1.4 billion. This wave of liquidations, the largest since 2021, forced short sellers to rapidly buy back spot Bitcoin and futures to cut losses, creating a short-squeeze spiral where higher prices triggered stronger buying, further driving up BTC prices.
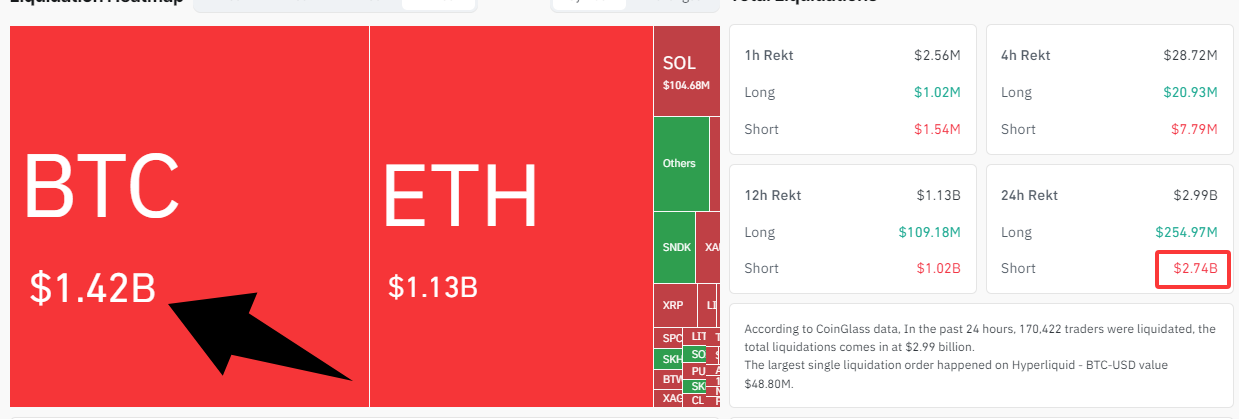 Crypto market liquidation data, source: Coinglass
Bitcoin Price Technical Analysis: Where Is the Next Resistance Level?
As Bitcoin's price broke above $67,000, it broke out of the range-bound consolidation of the past two-plus months and flipped that resistance level into support. Therefore, if BTC encounters a technical pullback while pushing toward the next resistance level, as long as the price holds and changes hands above $67,000, the overall extremely strong bullish structure will not be damaged.
At present, Bitcoin's price has only touched $70,000 without consolidating above this mark. It could potentially pull back to retest $67,000 before launching a new offensive. The next key, extremely strong resistance level is near $82,000, roughly 17% above current levels. It should be noted that a large volume of historical break-even selling pressure and profit-taking buy orders are concentrated at this level. BTC must achieve a solid breakout on expanded volume in this range to fully clear the structural resistance above and officially launch a new bull market.
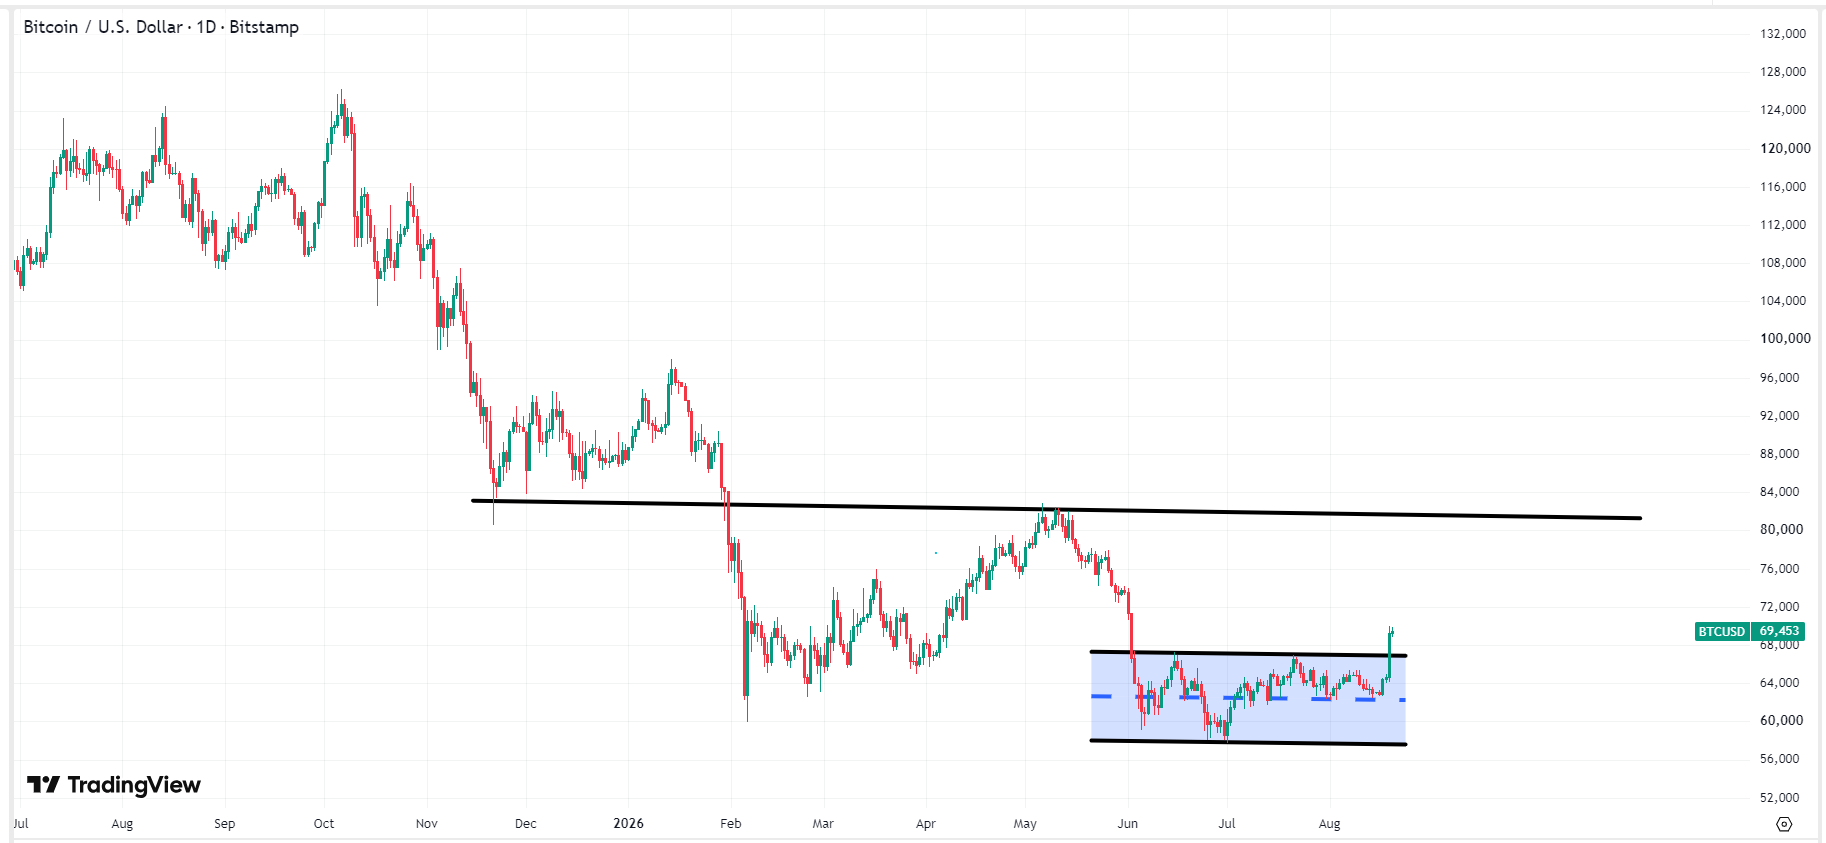 Bitcoin price chart, Source: TradingView
Recommended Articles


