


Novartis AG Stock (NVS) Moved Up by 3.82% on Aug 19: Key Drivers Unveiled
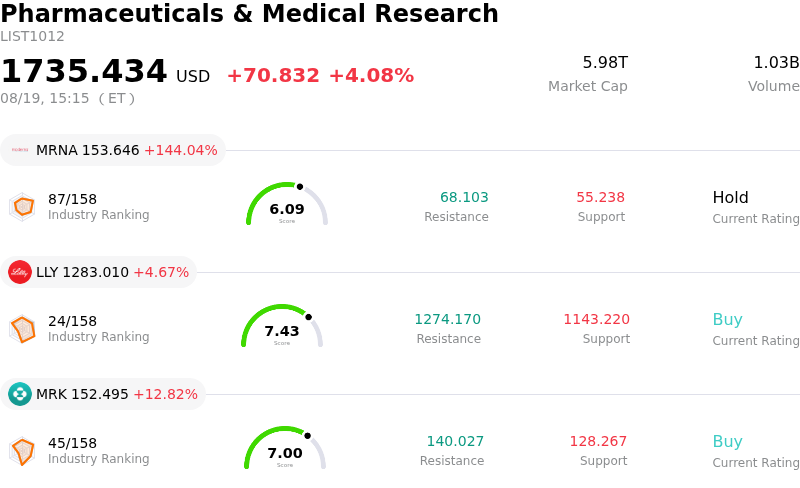
Novartis AG (NVS) moved up by 3.82%. The Pharmaceuticals & Medical Research sector is up by 4.08%. The company underperformed the industry. Top 3 stocks by turnover in the sector: Moderna Inc (MRNA) up 144.04%; Eli Lilly and Co (LLY) up 4.77%; Merck & Co Inc (MRK) up 12.87%.
What is driving Novartis AG (NVS)’s stock price up today?
Novartis saw strong upward price momentum during the session, propelled primarily by sustained investor confidence following its robust quarterly financial execution and expanding drug pipeline. Market sentiment surrounding the Swiss pharmaceutical giant remains buoyant as high-growth innovative therapies continue to outpace expectations. Strong momentum in core oncological and cardiovascular treatments, including Kisqali, Scemblix, Leqvio, and its radiopharmaceutical drug Pluvicto, has effectively tempered concerns regarding generic competition for mature products such as Entresto. The sustained double-digit growth of these flagship platforms reinforces institutional trust in management's full-year outlook and long-term earnings trajectory.
Beyond recent operational success, market enthusiasm has been heightened by Novartis' aggressive positioning in cutting-edge therapeutic areas, particularly radiopharmaceuticals. As one of the early pioneers and scale leaders in targeted radioligand therapies, the company's stated strategic interest in broadening its pipeline across additional oncology indications has highlighted its competitive moat. This strategic clarity, coupled with ongoing commentary surrounding potential strategic acquisitions and business development, has rekindled investor interest in the firm's long-term commercial execution.
From a broader market perspective, the upward trend was further supported by a general sector rotation into high-quality defensive healthcare assets. Amid broader macroeconomic uncertainty and fluctuating Treasury yields, institutional investors have increasingly favored mega-cap pharmaceutical names boasting solid balance sheets, resilient margins, and attractive dividend profiles. Recent institutional portfolio adjustments and renewed analyst interest emphasizing valuation stability have provided additional tailwinds, allowing the stock to attract strong buying momentum during the session.
Technical Analysis of Novartis AG (NVS)
Technically, Novartis AG (NVS) shows a MACD (12,26,9) value of -0.794, indicating a neutral signal. The RSI at 51.333 suggests neutral condition and the Williams %R at 42.283 suggests buy condition. Please monitor closely.
Fundamental Analysis of Novartis AG (NVS)
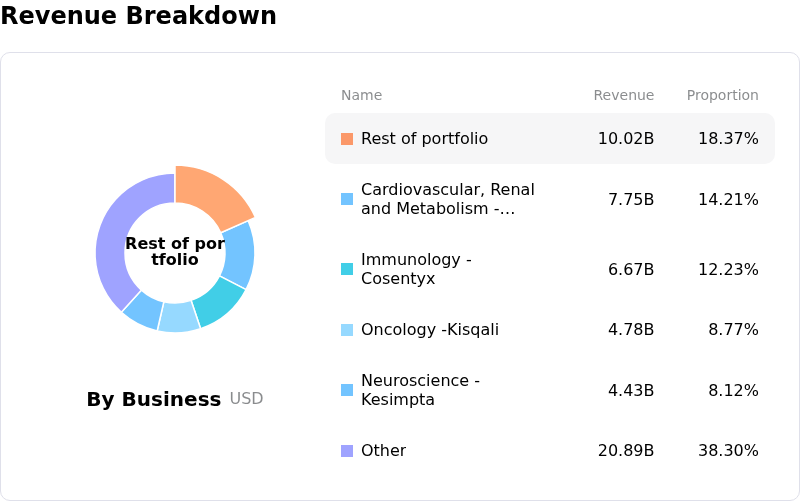
Novartis AG (NVS) is in the Pharmaceuticals & Medical Research industry. Its latest annual revenue is $56.33B, ranking 9 in the industry. The net profit is $13.98B, ranking 5 in the industry. Company Profile
Over the past month, multiple analysts have rated the company as Hold, with an average price target of $144.15, a high of $177.50, and a low of $106.21.
More details about Novartis AG (NVS)
Company Specific Risks:
- Multistate Generic Price-Fixing Antitrust Litigation: Ongoing legal enforcement led by a 48-state coalition of attorneys general targets Novartis and former subsidiary Sandoz over alleged price-fixing across 31 generic medications, creating significant legal exposure and potential settlement liabilities as discovery expands ahead of upcoming trial dates.
- Accelerated Generic Erosion in Key Revenue Blockbusters: Mature blockbuster therapies like Entresto continue to face severe revenue contraction (dropping ~46% following generic market entries), creating a substantial top-line drag that dampens core operating margins and offsets volume growth from newer oncology treatments.
- Unfavorable Rulings on US Drug Pricing Regulations: Multiple judicial setbacks—including federal appellate rejections of challenges against the Inflation Reduction Act's Medicare drug price negotiations and state-level 340B contract pharmacy mandates—limit commercial pricing flexibility and compress US profit margins.
- Valuation Premium and Technical Breakdown Signals: Broker consensus price targets ($141.20) remain below current trading levels, signaling overvaluation risks, while technical momentum indicators turning negative have triggered institutional position trimming and intraday selling pressure.
Recommended Articles


