


USD/CHF Price Forecast: 100-day SMA tested as US Dollar tanks
- USD/CHF breaks below 50-day SMA after Treasury buyback shock.
- RSI drop signals sellers are gaining near-term momentum.
- Break below 0.7975 exposes 0.7932 and 0.7900 next.
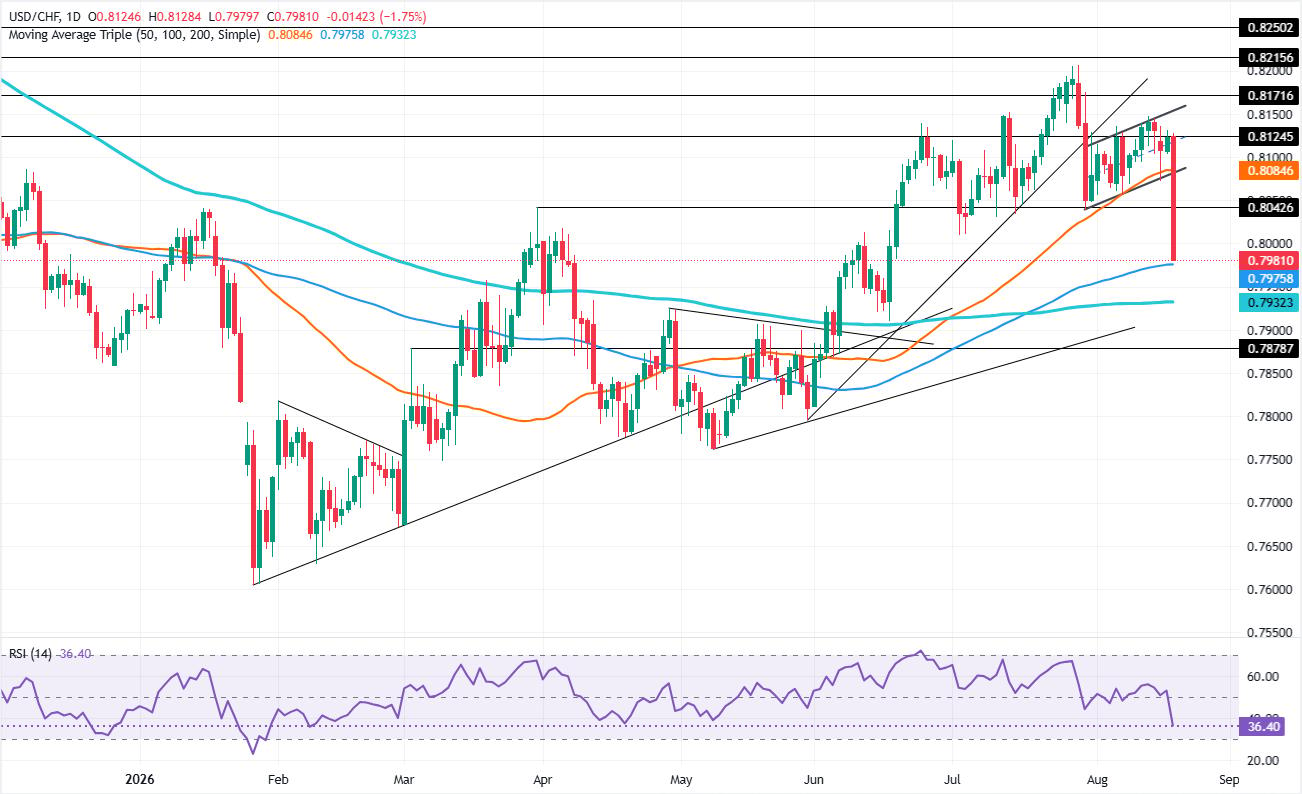
The USD/CHF tumbles nearly 2% on Wednesday as a US Treasury announcement of a buyback sent the Greenback into a tailspin, as US Treasury yields also dive. The pair trades at 0.7979 after reaching a high of 0.8128.
USD/CHF Price Forecast: Technical Outlook
From a technical perspective, the USD/CHF is upward-biased after it bottomed at 0.7604 in February of 2026. Since then, the pair has rallied towards a yearly high above 0.8200, before the US Treasury unveiled its bond buyback. This pushed the USD/CHF below key support levels, including the 50-day Simple Moving Average (SMA) at 0.8084, and towards the 100-day SMA at 0.7975.
In the short term, momentum shifted bearish as the Relative Strength Index (RSI) fell from around 51 to 36.48. This suggests that sellers are gaining steam.
For a bearish continuation, USD/CHF must clear the 100-day SMA, followed by the 200-day SMA, at 0.7932. On further weakness, the next stop is 0.7900.
On the flip side, buyers must reclaim the 0.8000 level before challenging the March 31 high of 0.8042. Above lies the 50-day SMA at 0.8084, followed by the August 13 high of 0.8147.
USD/CHF Price Chart – Daily
Swiss Franc FAQs
The Swiss Franc (CHF) is Switzerland’s official currency. It is among the top ten most traded currencies globally, reaching volumes that well exceed the size of the Swiss economy. Its value is determined by the broad market sentiment, the country’s economic health or action taken by the Swiss National Bank (SNB), among other factors. Between 2011 and 2015, the Swiss Franc was pegged to the Euro (EUR). The peg was abruptly removed, resulting in a more than 20% increase in the Franc’s value, causing a turmoil in markets. Even though the peg isn’t in force anymore, CHF fortunes tend to be highly correlated with the Euro ones due to the high dependency of the Swiss economy on the neighboring Eurozone.
The Swiss Franc (CHF) is considered a safe-haven asset, or a currency that investors tend to buy in times of market stress. This is due to the perceived status of Switzerland in the world: a stable economy, a strong export sector, big central bank reserves or a longstanding political stance towards neutrality in global conflicts make the country’s currency a good choice for investors fleeing from risks. Turbulent times are likely to strengthen CHF value against other currencies that are seen as more risky to invest in.
The Swiss National Bank (SNB) meets four times a year – once every quarter, less than other major central banks – to decide on monetary policy. The bank aims for an annual inflation rate of less than 2%. When inflation is above target or forecasted to be above target in the foreseeable future, the bank will attempt to tame price growth by raising its policy rate. Higher interest rates are generally positive for the Swiss Franc (CHF) as they lead to higher yields, making the country a more attractive place for investors. On the contrary, lower interest rates tend to weaken CHF.
Macroeconomic data releases in Switzerland are key to assessing the state of the economy and can impact the Swiss Franc’s (CHF) valuation. The Swiss economy is broadly stable, but any sudden change in economic growth, inflation, current account or the central bank’s currency reserves have the potential to trigger moves in CHF. Generally, high economic growth, low unemployment and high confidence are good for CHF. Conversely, if economic data points to weakening momentum, CHF is likely to depreciate.
As a small and open economy, Switzerland is heavily dependent on the health of the neighboring Eurozone economies. The broader European Union is Switzerland’s main economic partner and a key political ally, so macroeconomic and monetary policy stability in the Eurozone is essential for Switzerland and, thus, for the Swiss Franc (CHF). With such dependency, some models suggest that the correlation between the fortunes of the Euro (EUR) and the CHF is more than 90%, or close to perfect.
Recommended Articles


