

Crypto liquidations near $2 billion as US Treasury debt buyback sparks short squeeze

Source Fxstreet
  • The crypto market saw nearly $2 billion in liquidations after a price jump wiped out short positions.
  • Bitcoin and Ethereum gained 5% and 9%, respectively, as the short squeeze pushed crypto prices higher.
  • The intense short liquidations follow the US Treasury's decision to double its debt buyback operation.

The cryptocurrency market has seen nearly $2 billion in liquidations over the past 24 hours, its largest since February 5.

Short liquidations accounted for $1.75 billion, their largest since the October 10 leverage flush, and represented the first major short squeeze in a long while.
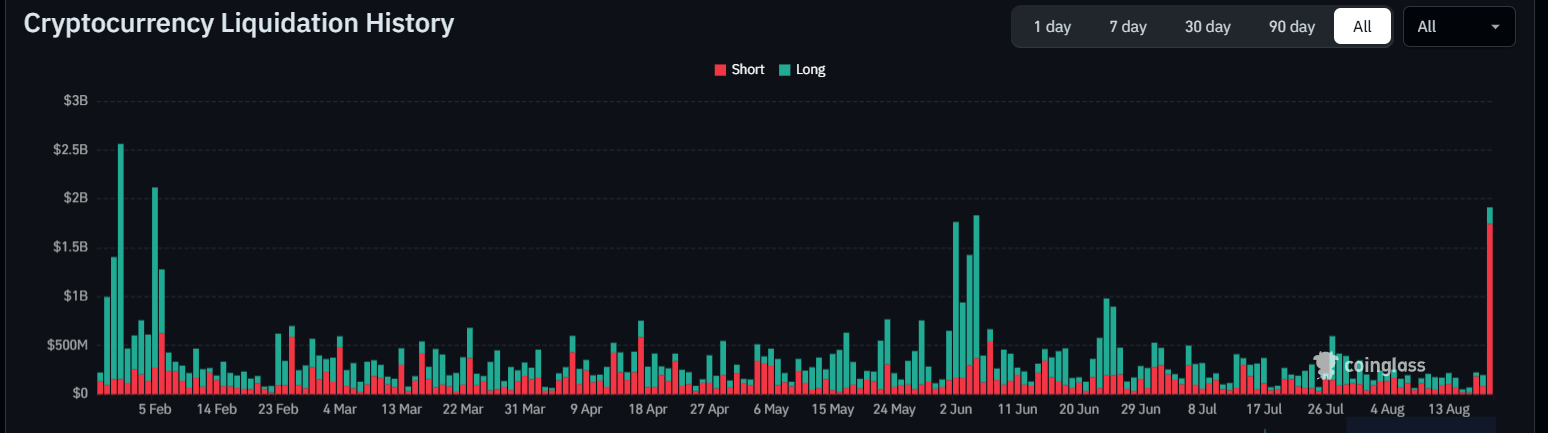
Crypto Liquidation History. Source: Coinglass

Short squeezes are a fast, sharp rise in an asset's price that forces traders who bet on downside (short sellers) to buy the asset back to cut losses. This buying rush pushes the price even higher.

Bitcoin (BTC) gained over 5% as it edged above $68,000 following the move, its highest level since June 2. Liquidations for the top crypto reached $1.14 billion, with shorts representing $1.11 billion.

Ethereum (ETH) saw a 9% jump, climbing past the $2,000 psychological level for the first time since June 1. The top altcoin saw $513.6 million in liquidations, led by $464.8 million in short liquidations.

Solana (SOL) and XRP also posted notable gains, both rising by roughly 6% in the past 24 hours at the time of writing.

US Treasury debt buyback expansion improves crypto sentiment

Most of the recent rise and liquidations, roughly $1.8 billion, came within four hours of the US Treasury's decision to double buybacks for long-dated bonds. The operation will take effect from September 4 through November 4, after which the Treasury "will provide more information about future buyback sizes at the next Quarterly Refunding," scheduled for the same day.

After the move, the 30-year bond yield dropped to 5.197%, a 14-basis-point decline from its multi-decade high of 5.337%, which it set earlier on Tuesday. The 10-year bond barely flinched as it dropped from 4.677% to 4.657%, while the 5-Year Note eased from 4.382% to 4.359%.

The decline in bond yields is also improving the wider crypto market sentiment. The CMC Crypto Fear and Greed Index has jumped from near-Fear territory at 41 to Neutral at 51. That represents its highest level since mid-May.
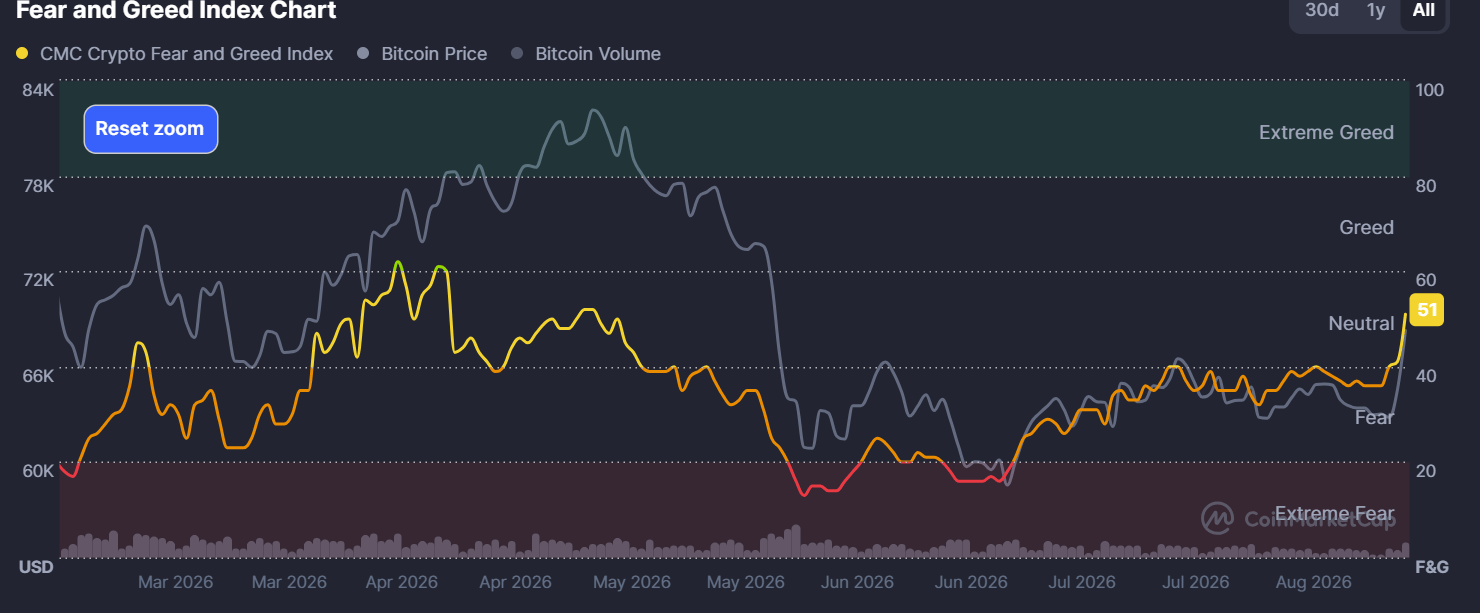
Crypto Fear and Greed Index Chart. Source: CoinMarketCap

The general crypto market cap is at $2.4 trillion, up 5% over the past 24 hours, at the time of writing.

Disclaimer: For information purposes only. Past performance is not indicative of future results.
placeholder
Gold Price Analysis Today: Gold Rebounds After 1.91% Drop as Yields Ease. Is $4,449 Next? Gold fell about 1.91% on August 18 before producing a strong bullish reaction from the 1-hour demand zone in early August 19 trading. RSI is recovering from oversold conditions, but Supertrend remains bearish as traders await the Fed minutes.
Author  Naoufal Seddik
15 hours ago
Gold fell about 1.91% on August 18 before producing a strong bullish reaction from the 1-hour demand zone in early August 19 trading. RSI is recovering from oversold conditions, but Supertrend remains bearish as traders await the Fed minutes.
placeholder
Gold Price Analysis Today: Gold Gains 0.94% as Markets Expect Fed to Hold Rates, Can $4,449 Resistance Break? Gold gained 0.94% on August 17, closing near $4,417.30 as softer US data strengthened expectations for unchanged Fed rates in September. Gold remains bullish, with $4,449.730 resistance and $4,310.650 support in focus.
Author  Naoufal Seddik
Yesterday 07: 02
Gold gained 0.94% on August 17, closing near $4,417.30 as softer US data strengthened expectations for unchanged Fed rates in September. Gold remains bullish, with $4,449.730 resistance and $4,310.650 support in focus.
placeholder
Gold Price Analysis Today: Gold Drops 1.32% Despite Lower Fed Rate-Hike Bets, Can $4,313 Support Hold? Gold fell 1.32% on August 13 after rising to $4,449.73, then reversing lower and closing near $4,349.918 below the $4,356.46 support. Softer US inflation data reduced Fed rate hike expectations, but selling pressure still dominated the session. Will $4,313 support hold?
Author  Naoufal Seddik
Aug 14, Fri
Gold fell 1.32% on August 13 after rising to $4,449.73, then reversing lower and closing near $4,349.918 below the $4,356.46 support. Softer US inflation data reduced Fed rate hike expectations, but selling pressure still dominated the session. Will $4,313 support hold?
placeholder
XAUUSD Gold Analysis: Gold Holds Above $4,350 Ahead of US Inflation Data Is $4,500 Next? Gold holds above $4,350 following weak US jobs data. As inflation reports approach and UBS eyes $5,000, can XAUUSD break resistance at $4,435 to rally toward $4,500?
Author  Naoufal Seddik
Aug 12, Wed
Gold holds above $4,350 following weak US jobs data. As inflation reports approach and UBS eyes $5,000, can XAUUSD break resistance at $4,435 to rally toward $4,500?
placeholder
Intel Price Forecast: Nvidia Picked Xeon 6, Invested $5B, Yet Analysts Still Trail INTCIntel Corporation (NASDAQ: INTC) sits at $140.05, holding firm on the ascending trendline within the 2H timeframe. The RSI indicator is currently reading 55.21, positioning it as neutral-
Author  TradingKey
Jul 02, Thu
Intel Corporation (NASDAQ: INTC) sits at $140.05, holding firm on the ascending trendline within the 2H timeframe. The RSI indicator is currently reading 55.21, positioning it as neutral-
goTop
quote