


Natural Gas (NATGAS) Surges on Aug 9: Key Factors to Watch
Natural Gas (NATGAS) is up 3.22% at Aug 9 18:05(ET), now at $2.758, with a 7-day down of 0.47%.
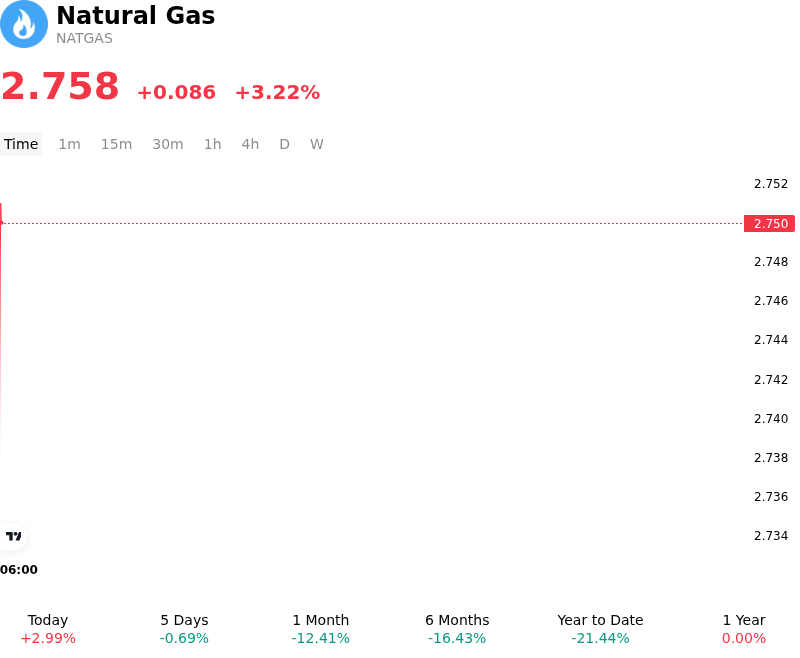
What is driving Natural Gas (NATGAS)’s stock price up today?
The primary driver behind the recent upward momentum in natural gas prices is a significant shift in medium-term weather forecasts, which now indicate an expansion of extreme heat across high-demand regions of the US Midwest and Northeast. This revision in the 10-to-14-day outlook has materially increased expectations for power-sector gas consumption, as utilities ramp up electricity generation to meet peak cooling loads. The market is pricing in a sustained period of above-average cooling degree days, which directly challenges the pace of seasonal storage injections.
Complementing the weather-driven demand is a tightening supply-side narrative. Daily production estimates from the Lower 48 have shown signs of stagnation, as major producers maintain capital discipline and limit new drilling activity in response to the volatile pricing environment seen earlier in the year. Furthermore, feedgas flows to major liquefied natural gas export terminals have remained near nameplate capacity, reflecting robust international demand for US cargoes. This structural shift in the domestic balance, where LNG exports act as a persistent floor for demand, amplifies price sensitivity to domestic weather shocks.
Inventory dynamics are also playing a critical role in the current price action. Market participants are increasingly focusing on the trajectory of storage builds, with consensus estimates shifting toward a notably leaner injection than the five-year average for the current reporting period. As the total storage surplus relative to historical norms continues to erode, concerns are mounting regarding the adequacy of buffer stocks heading into the late-summer hurricane season and the subsequent winter heating period. The reduction in the storage overhang has removed a significant headwind, allowing the market to react more aggressively to immediate supply-demand imbalances.
Institutional positioning has likely accelerated the move, as key technical resistance levels were breached during the session. The transition from a bearish to a more neutral or bullish sentiment has triggered a round of short-covering among managed money participants. With these technical triggers activated, the influx of capital reflects a broader repricing of risk as the market acknowledges the possibility of a tighter market balance through the remainder of the third quarter. Traders remain highly sensitive to any further deviations in weather models or infrastructure disruptions, which could further strain the supply outlook.
Technical Analysis of Natural Gas (NATGAS)
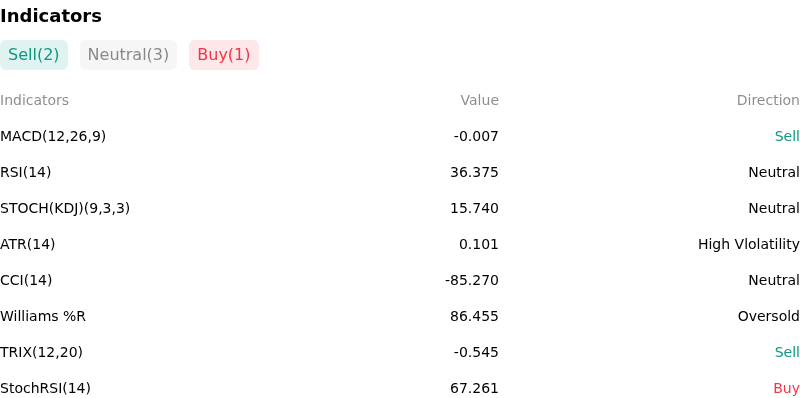
Technically, Natural Gas (NATGAS) shows a MACD (12,26,9) value of -0.007, indicating a sell signal. The RSI at 36.375 suggests neutral condition and the Williams %R at 86.455 suggests oversold condition. Please monitor closely.
More details about Natural Gas (NATGAS)
Recent Events and Risks:
- Bearish Shift in Weather Forecasts: Updated meteorological models for the late-August period indicate a transition toward milder temperatures across the Midwest and Northeast, threatening to significantly erode cooling degree day (CDD) demand and accelerate the seasonal transition to the low-demand shoulder season.
- Persistent Inventory Surplus Overhang: Recent storage data confirms that Lower 48 stocks remain more than 10% above the five-year average, creating a structural supply cushion that invites aggressive short-selling whenever weekly injections align with or exceed market expectations.
- Production Resilience and Rebounds: Despite previous producer guidance on curtailments, daily pipeline flow data shows Lower 48 dry gas production holding steady above 101 Bcf/d as maintenance projects conclude, maintaining downward pressure on prices as the market struggles to absorb excess supply.
- LNG Feedgas Volatility: Recent fluctuations in feedgas deliveries to major Gulf Coast export terminals, potentially linked to unannounced maintenance or operational constraints, have reduced immediate domestic demand and increased the risk of localized supply gluts at Henry Hub-linked delivery points.
Recommended Articles


