


Will US Stocks Rise After Midterm Elections? Analysis of Historical Election Data and Market Patterns


TradingKey - As the U.S. midterm elections approach, in addition to focusing on the election results and their impact on economic policies, investors are also searching for clues regarding the next phase of U.S. stock market trends.
Although the S&P 500 Index remains near record highs, semiconductor and popular AI stocks have experienced a noticeable pullback recently, and market concerns over high valuations, returns on AI capital expenditure, and the interest rate outlook have not faded.
Historical data offers a relatively optimistic answer. Following the conclusion of midterm elections, U.S. stocks typically enter a phase of stronger performance. However, this pattern primarily reflects a decrease in political uncertainty, stabilizing policy expectations, and improving corporate earnings, and does not mean the market will inevitably rise.
US Stocks Are Typically Strong After Midterm Elections
According to statistics from Matt Cerminaro, founder of Exhibit A, the S&P 500 Index has posted an average gain of 15.5% from Midterm Election Day through June 30 of the following year since 1950. Another study by JPMorgan also shows that since 1950, the S&P 500 has generated positive returns in the 12 months following every midterm election, with an average gain of approximately 15%.
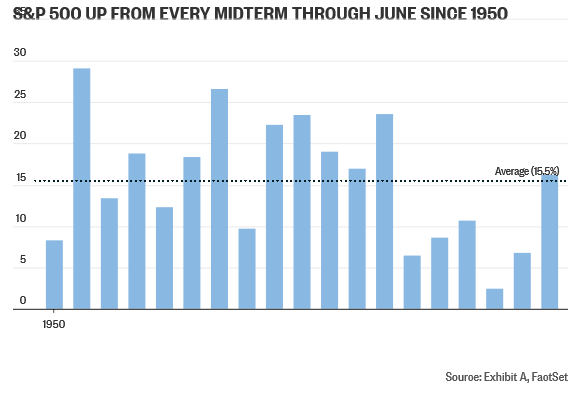
If the observation window is narrowed to the six months following an election, the seasonal pattern is equally evident. Since the S&P 500 Index was established in 1957, the index has never posted a negative return during the November-to-April period following a midterm election, and its overall performance has significantly outperformed the same period in other years of a presidential term.
Why US Stocks Are More Likely to Rise After Midterm Elections
A decline in political uncertainty is an important factor explaining this pattern. Research by Terry Marsh, professor emeritus of finance at UC Berkeley, and Kam Fong Chan, professor at the University of Western Australia, found that the U.S. Economic Policy Uncertainty Index typically rises in the months leading up to midterm elections and falls significantly after the elections.
After the election results are announced, investors can more accurately gauge the congressional power structure and the future direction of taxation, fiscal spending, and industry regulation. As political risks that need to be priced into stock prices decrease, capital often flows back into risk assets such as equities.
Historical data also shows that the market does not consistently favor any single political party. Compared to a victory by the Republicans or Democrats, whether the policy environment is stable and whether the structure of government power is clear generally have a more direct impact on asset prices. Fidelity research shows that weak performance in midterm election years is often linked to rising policy uncertainty rather than investors simply supporting a specific party.
Seasonal factors also help: the period from November after the midterm elections through April of the following year is inherently a traditionally strong period for U.S. equities. The waning of election uncertainty coinciding with favorable seasonality makes historical returns during these six months particularly notable.
Why the Third Year of a Presidential Term Usually Performs Best
Following the midterm elections, the U.S. will enter the third year of the presidential four-year term. According to data from CFRA Research, the S&P 500 Index has averaged a gain of 16.3% in the third year of a presidential term, higher than the first year's 9.5%, the second year's 3.8%, and the fourth year's 6.8%.
In terms of quarterly performance, the fourth quarter of a midterm election year rises by an average of 6.4%, ranking second among all 16 quarters in the four-year cycle; closely following it, the first quarter of the third year averages a 7% gain, making it historically the strongest quarter.
This pattern may be linked to policy cycles: to campaign for the next presidential election, the governing party typically pushes policies in the second half of its term to stimulate the economy, improve employment, or raise household income. These measures are gradually reflected in consumption, investment, and corporate earnings, thereby providing fundamental support for the stock market.
However, fiscal stimulus does not come without a price. If policies further drive up deficits, inflation, and Treasury yields, highly valued growth stocks may instead face greater pressure. Therefore, the historical advantage of the third year still requires support from the interest rate and corporate earnings environment.
Can US Stocks Repeat Historical Patterns in 2026
One of the market's biggest headwinds currently is high interest rates. Even as the 10-year U.S. Treasury yield once pulled back below 5%, long-term financing costs remain at multi-year highs. Higher risk-free yields diminish the relative appeal of equities and increase the costs for companies to construct data centers, procure AI chips, and expand production capacity.
The return on AI capital expenditures will also impact the post-election market trend. Big tech companies such as Meta are committing massive funds to build computing infrastructure, but the market is increasingly focused on when this capex can translate into revenue and free cash flow. If growth in cloud computing, advertising, and enterprise AI businesses fails to cover depreciation and financing costs, tech stock valuations may remain under pressure.
The upcoming Anthropic IPO may also add liquidity-drainage pressure to the stock market. A large-scale initial public offering requires absorbing substantial liquidity; if it coincides with high interest rates and waning risk appetite, short-term volatility in the tech sector could amplify further.
On a relatively positive note, U.S. mega-cap corporate earnings remain resilient. As long as 2027 earnings expectations are not significantly revised downward, corporate profit growth could offset some of the pressure from interest rates and oil prices. Given that tech stocks account for nearly 40% of the S&P 500's weight, for the index to replicate historical post-election gains, tech giants including Microsoft, Nvidia, Apple, Amazon, and Meta will still need to participate in the rally.
Overall, historical data following U.S. midterm elections is relatively optimistic for U.S. equities, but what truly drives the market is not the election itself, but rather reduced political uncertainty, stable policy expectations, and corporate earnings growth. The historical average gain of around 15% can serve as a reference for market research, but should not be viewed as a definitive forecast. Once the election concludes, investors will still need to closely monitor Treasury yields, inflation, AI investment returns, and earnings guidance from big tech companies.
Read more
* The content presented above, whether from a third party or not, is considered as general advice only. This article should not be construed as containing investment advice, investment recommendations, an offer of or solicitation for any transactions in financial instruments.


