


Gold Price Analysis Today | Forex Gold Analysis | XAU/USD Analysis - November 2, 2026


Today's Gold Price
Gold price chart for today
*0% Commission and Low Spreads 0️⃣
*$50,000 in Free Virtual Funds 💰
*$100 New Customer Bonus 🎁
Gold (XAU/USD) plunged to a year low near $3,900.10 this morning (November 2, 2026), hit by forced liquidation as investors covered losses in Wall Street equities. At the same time, Brent crude rose above $117 after a vessel attack in the Strait of Hormuz, reviving inflation concerns and supporting expectations of further Fed rate hikes. Today's focus is whether the key $3,885–3,904 support zone can withstand the pressure.
Today's Key Points
| Key Takeaways |
|
|
|
Wall Street Technology-Stock Selloff Triggers Forced Liquidation Across Gold Market, Pushing Prices Below $3,900 Despite Lower Treasury Yields
A major selloff in Wall Street technology stocks hit commodities hard as institutional investors faced margin calls and had to sell highly liquid assets such as gold and silver to raise cash. Spot gold fell more than 3.5% to $3,879.90, while silver tumbled more than 6% below $50 to $48.95.
The rush for cash meant gold did not benefit from falling U.S. Treasury yields. The 10-year yield fell to 4.93% and the two-year yield declined to 4.58%, but market demand for liquidity exceeded demand for safe-haven assets, leaving gold under heavy pressure.
Brent Crude Rises to $117 After Tanker Attack in Hormuz, Reviving Inflation Concerns and Reinforcing Fed Policy Tightening
Tensions in the Middle East intensified after a tanker was attacked in the Strait of Hormuz, pushing Brent crude up 2.4% to close at $117.64 a barrel, its highest level since April. Brent rose more than 13.6% in October, while WTI jumped 15.2% above $104 a barrel.
Surging energy prices have raised concern that inflation will accelerate, consistent with the latest Core PCE reading of 3.1% and robust third-quarter GDP growth of 3.4%. These factors support market expectations that the Fed will raise rates in December and continue through early 2027, increasing the opportunity cost of holding gold and keeping pressure on prices.
Gold Faces a Paradox as Weaker Dollar and Falling Yields Fail to Help; Investors Delay Purchases Ahead of Midterm Elections
Gold faced a pronounced paradox during the week. Although the Fed held rates at 3.75%–4.00%, Kevin Warsh continued to signal a hawkish stance on inflation, alongside two dissenting officials. Investors also chose to delay asset holdings ahead of the U.S. midterm election on November 3.
On the other hand, concern that high rates will persist because of surging oil prices has led institutional investors to hold cash while awaiting the midterm election result and nonfarm payrolls data later in the week before assessing the next opportunity to accumulate gold.



Technical Analysis of Gold (XAU/USD)
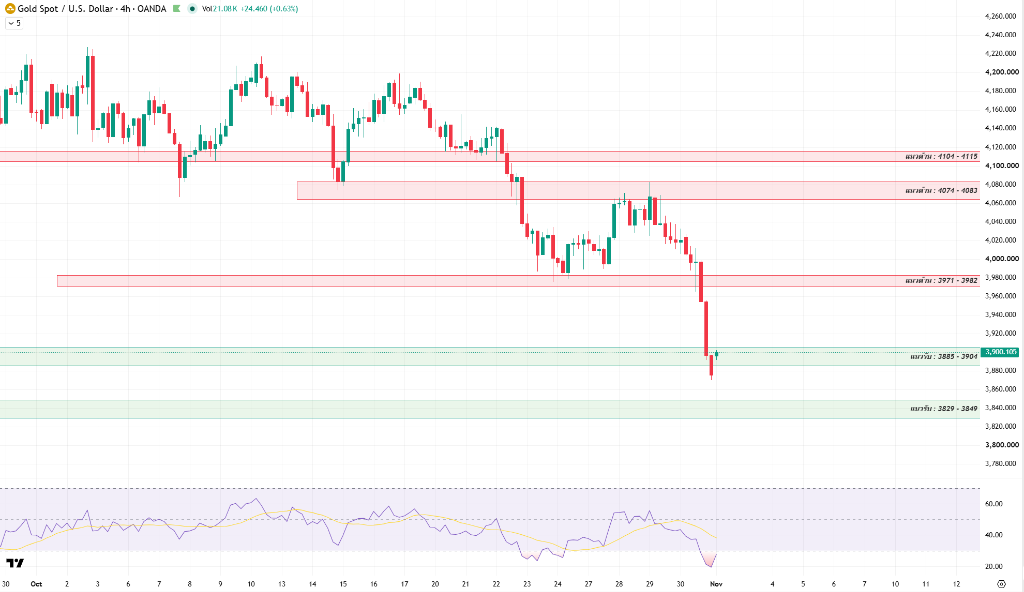
On the four-hour chart, gold has broken below the $4,000 psychological support level and the $3,971–3,982 zone, reaching a year low near $3,879.90 before buying absorbed liquidity and supported prices near $3,900.10. However, the main structure remains bearish below all moving averages.
The RSI is deeply oversold at around 20–25, suggesting selling pressure is beginning to ease and creating scope for a short-term technical rebound. However, while it remains below 40, the recovery is limited until higher lows form.
The key test is a reclaim and close above the initial $3,971–3,982 resistance zone. Until then, beware of a bull trap that could allow selling pressure to push prices down to retest the $3,885–3,904 base.
If prices hold above $3,885–3,904 and clear $3,971–3,982, a recovery could extend toward $4,074–4,083 and $4,104–4,115. A break below $3,885, however, would risk a decline toward $3,829–3,849 and then $3,780–3,800.
Today's Gold Price Outlook
| Scenarios |
|
|
|
Today's Trading Strategy
Short-term traders should trade the range cautiously. Wait for signs that selling is being absorbed near $3,885–3,904 support before opening positions, avoid chasing prices until they clear the first resistance zone, and always use a stop-loss.
- Buy setup: Look for a pullback to $3,885–3,904 support with clear buying support and RSI rebounding from oversold territory, or follow a break above $3,982. Profit targets are at $4,074–4,083, with a stop-loss below $3,875.
- Sell setup: Consider short positions if prices rebound to $3,971–3,982 or $4,074–4,083 resistance and meet price rejection, or if they fall below $3,885. Targets are around $3,829–3,849, with a stop-loss above resistance.
For long-term investors, structural support from inflation risk and U.S. debt remains in place. Consider accumulating on pullbacks to the $3,829–3,849 or $3,780–3,800 support bases.
Daily Support and Resistance Levels
| Type | Price Level |
| Support #1 | $3,885–3,904 |
| Support #2 | $3,829–3,849 |
| Support #3 | $3,780–3,800 |
| Resistance #1 | $3,971–3,982 |
| Resistance #2 | $4,074–4,083 |
| Resistance #3 | $4,104–4,115 |
Today's Questions (FAQ)
Why Did the Wall Street Stock-Market Selloff Pressure Gold Below $3,900?
When U.S. equities fall sharply, institutional investors face margin calls and may need to sell profitable, highly liquid assets such as gold and silver to cover losses and raise cash. Gold can therefore face sudden liquidation selling even though it is a safe-haven asset.
Why Didn't Surging Oil Prices From Hormuz Tensions Support Gold Prices?
Brent crude's rise to $117 revived concern that inflation would accelerate, leading markets to expect the Fed to keep rates higher for longer and possibly raise them further. This raises gold's opportunity cost, so investors chose to hold cash ahead of the midterm election.
Read more
The above content was completed with the assistance of AI and has been reviewed by an editor.


