


TJX Gave Back Part of Its 11% Jump. Can the Stock Break the $143.75 Trendline?
TradingKey - TJX Companies (NYSE: TJX), the owner of TJ Maxx, Marshalls and HomeGoods, closed at $140.30 on Wednesday, November 18, up 8.05% from $129.85, after reporting fiscal third-quarter results before the open. The stock rose as much as about 11% during the session before sellers trimmed the gain, and premarket quotes are flat at $140.32.
The quarter beat the company's own plan on comparable sales, profit margin and EPS, and TJX lifted its full-year comparable sales outlook. Even after the jump, the stock sits about 17.5% below its 52-week high of $170.00, by my calculation, so the rally has repaired only part of the damage from earlier in the year.
A Quarter That Beat the Plan
Net sales rose 6% to $15.95 billion, slightly above the $15.85 billion consensus, according to 24/7 Wall St. Adjusted EPS, which excludes a $0.05 benefit from tariff refunds, rose 5% to $1.34, one cent above estimates, while reported diluted EPS rose 9% to $1.39. 24/7 Wall St counts this as the sixth straight quarter in which TJX beat consensus.
The bigger surprise came against TJX's own guidance. Comparable sales, which compare stores open at least a year, rose 4% against a plan of 2% to 3%. The adjusted pretax margin, the share of sales left as profit before tax, came in at 12.5%, above the 12.3% to 12.4% plan, although it was still 0.2 percentage point lower than a year earlier.
Costs explain that margin dip. The adjusted gross margin fell 0.5 point to 32.1% because of higher freight and fuel costs, and Marmaxx paid extra to rush in some inventory late in the quarter. CFO John Klinger said, "The expediting of inventory, we don't expect that in the fourth quarter."
Marmaxx Is the Weak Spot
The divisions tell a split story. Marmaxx, which runs TJ Maxx and Marshalls in the US and brings in about $9.3 billion of the quarter's sales, grew comparable sales only 2%, down from 6% a year earlier. HomeGoods held steady at 5%, TJX Canada rose 6%, and TJX International sped up to 8% from 3%.
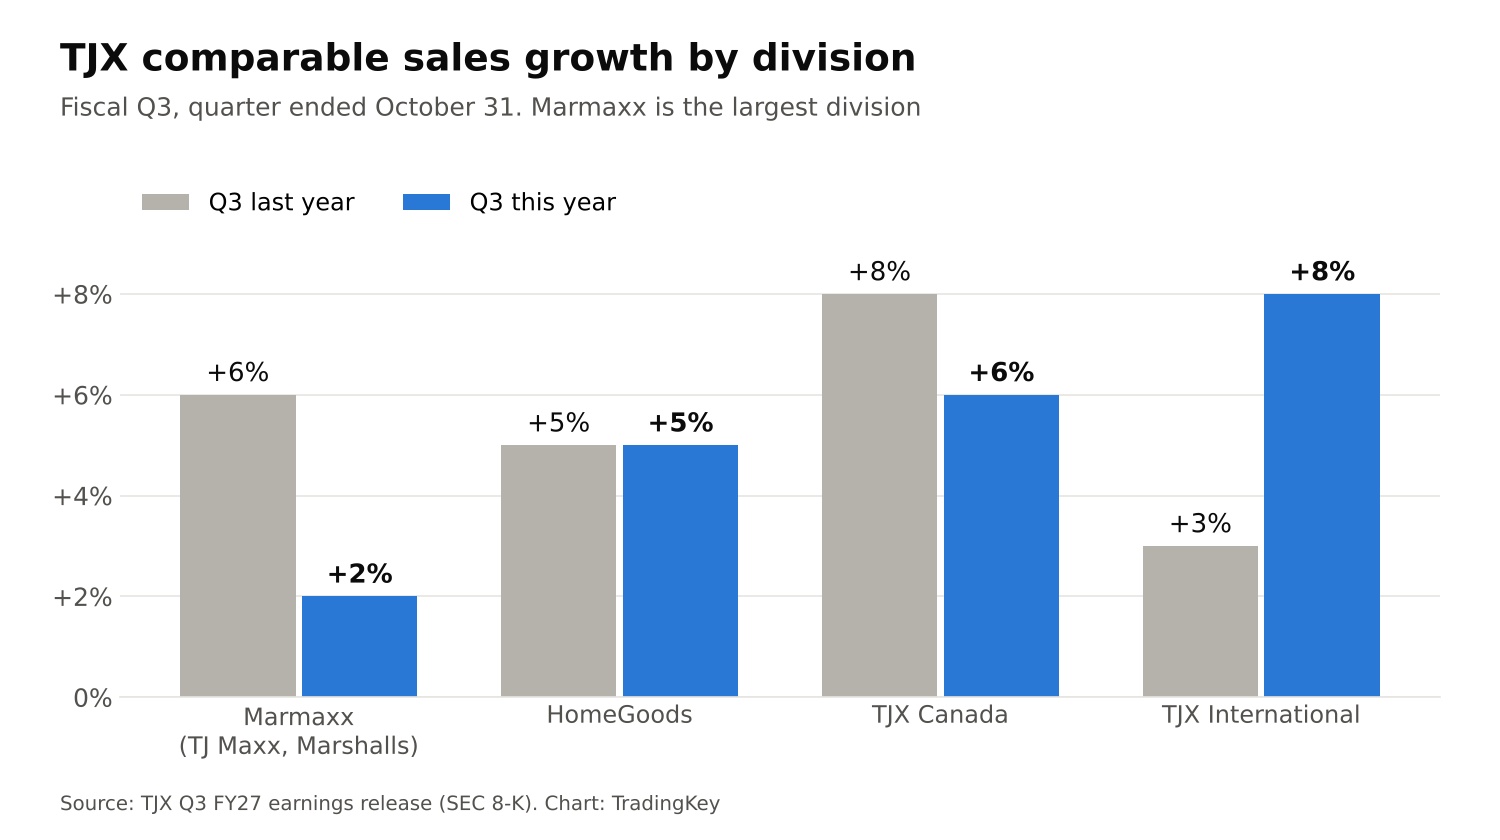
TJX Comparable Sales Growth by Division - Source: TJX Q3 FY27 Earnings Release
CEO Ernie Herrman said Marmaxx's 2% was in line with expectations and that the second half of the quarter was stronger than the first. He blamed "a handful of areas," including planning and allocation, and said he believes "the execution issues will be largely behind us by the end of the year." That is a promise the fourth quarter now has to keep, since Marmaxx is by far the largest division.
The outlook adds a near-term risk. Herrman said unseasonably warm weather in the US and Canada has held back demand in some categories so far, but he still expects "sales momentum to accelerate throughout the holiday selling season."
Guidance Edged Up, but Still Trails the Street
TJX now expects full-year comparable sales growth of 4%, the top of its earlier 3% to 4% range. Adjusted EPS guidance moved to $5.17 to $5.20 from $5.15 to $5.20, and the adjusted pretax margin target held at 12.0% to 12.1%, even though the company now plans for higher fuel costs.
Notice what did not happen, though. The new adjusted EPS range still sits below the roughly $5.23 consensus, according to Yahoo Finance, and fourth-quarter adjusted EPS guidance of $1.42 to $1.45 is lower than the company previously implied because of fuel. Investors bought the stock anyway, which shows they cared more about the sales beat and the holiday tone than about the small earnings gap.
For the fourth quarter, TJX guides comparable sales up 2% to 3% on net sales of $18.3 billion to $18.5 billion, with an adjusted pretax margin of 11.8% to 11.9%.
Buybacks, Store Growth and Valuation
TJX returned $1.5 billion to shareholders in the quarter, $1.0 billion through buybacks of 7.3 million shares and $529 million in dividends, after repaying $1.0 billion of maturing debt. It now plans about $3.0 billion of buybacks this fiscal year, with about $1.7 billion left under its program. Inventory per store was flat, so the company is not carrying excess stock into the holidays.
It also plans to grow its store count by about 4% a year starting next year, from 5,349 stores today, toward a long-term target of 7,500. Before the report, the stock traded at about 24 times forward earnings, slightly below its five-year average of about 25 times, according to Yahoo Finance. At $140.30, it trades at about 27 times the midpoint of the new adjusted EPS guidance.
Retail news keeps coming today. Walmart reports before the US open, a day after Target posted comparable sales growth of 5.6% and raised its outlook, so investors will judge TJX's 4% against both.
TJX Technical Analysis: 4-Hour Close Above $143.75 Could Break the Triangle
The 4-hour chart shows why the gain faded. Buyers stepped in strongly at $129.53, the rising trendline from September, and that bounce carried the stock to $144.11 in a single surge. Sellers then pushed back at $143.75, where the falling trendline from August sits. Trendlines connect a series of higher lows or lower highs, and together these two now form a triangle, a pattern that often ends in a sharp move once price breaks out of it.
Price still holds above both moving averages, which track the average price over recent sessions, near $138. RSI, a momentum gauge that runs from 0 to 100, has climbed to about 56 and sits above its signal line. The MACD, another momentum indicator, has also crossed higher, so momentum is shifting toward buyers.
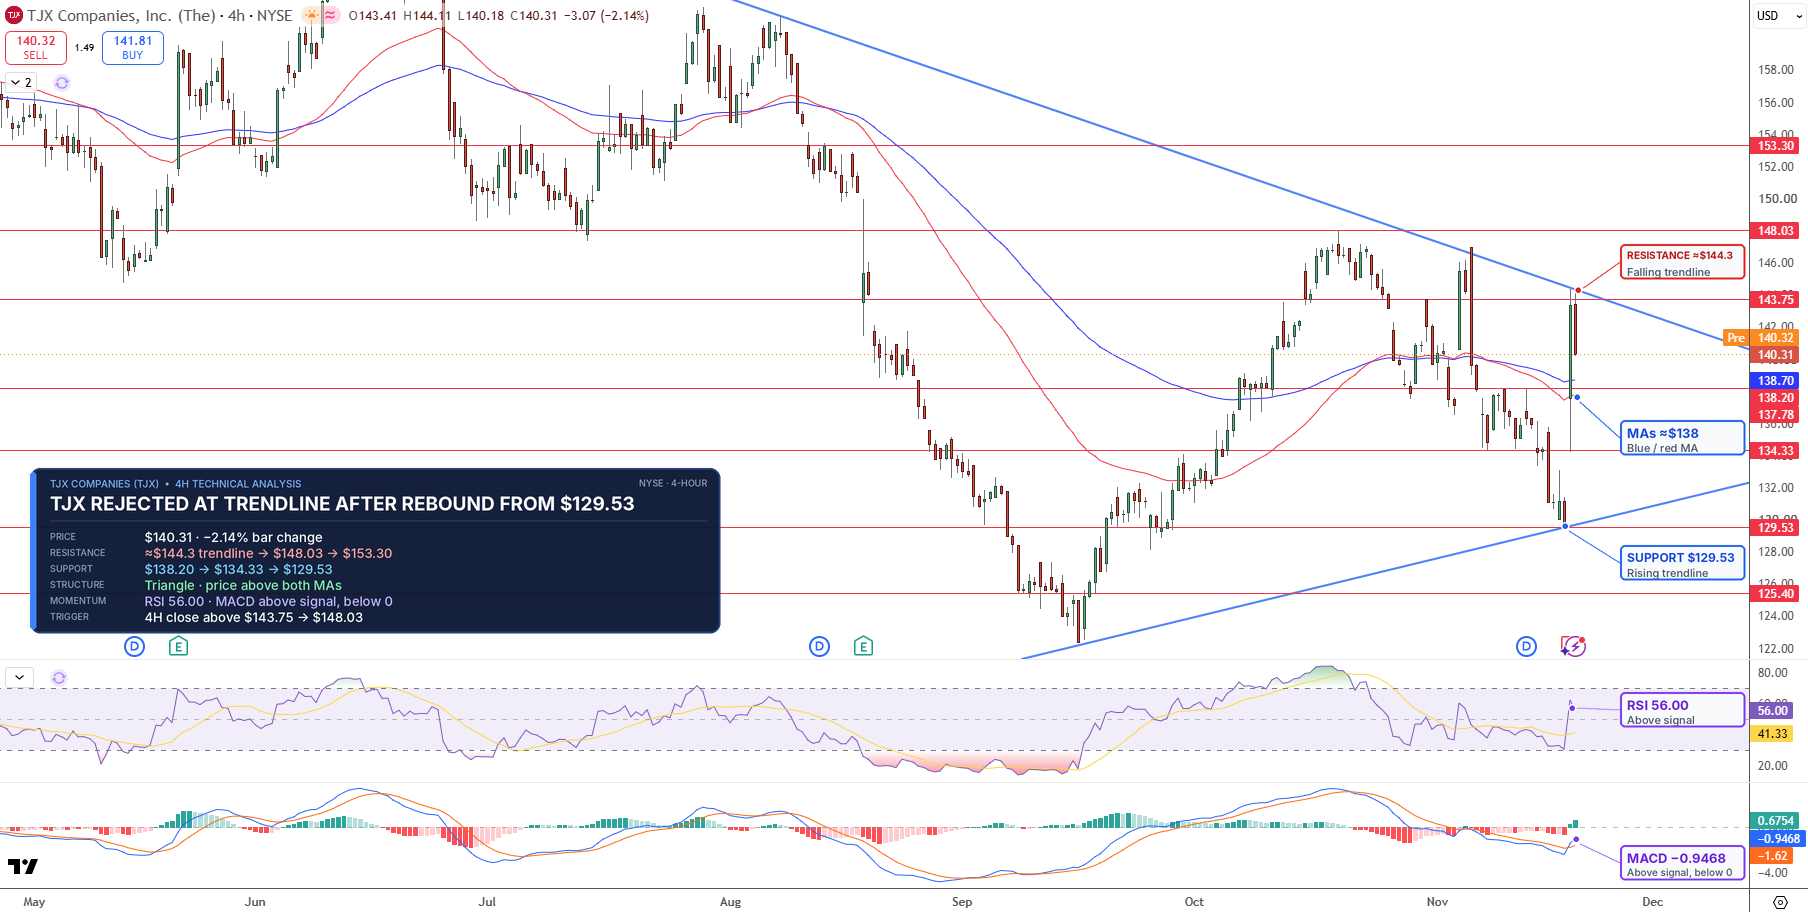
TJX Price Chart - Source: Tradingview
A 4-hour close above $143.75 would break the triangle higher and could open $148.03, followed by $153.30. On the downside, a 4-hour close below $137.78 could send TJX toward $134.33.
I'm cautiously bullish while TJX holds above $137.78, with $143.75 as the key breakout level.
Key Levels
- Last close: $140.30, up 8.05% on Wednesday, November 18 (premarket: $140.32)
- Support: $137.78, $134.33, $129.53
- Resistance: $143.75, $148.03, $153.30
- RSI: 56.00
- Bullish trigger: 4-hour close above $143.75
- Bearish trigger: 4-hour close below $137.78
FAQs
Why did TJX stock jump after earnings?
TJX beat its own third-quarter plan, with comparable sales up 4% against a 2% to 3% plan, adjusted EPS of $1.34 against $1.30 to $1.32, and a 12.5% adjusted pretax margin. It also raised its full-year comparable sales outlook to 4% and said it expects holiday sales momentum to accelerate.
What is the TJX stock forecast now?
The bias is cautiously bullish while TJX holds above $137.78. A 4-hour close above $143.75 could open $148.03 and $153.30, while a close below $137.78 could send the stock toward $134.33.
Bottom Line
TJX beat its own plan and sounded confident about the holidays, but Marmaxx grew only 2% and full-year EPS guidance still trails the Street. The level that matters is $143.75. In my view, a 4-hour close above it would confirm the post-earnings breakout, while a slip below $137.78 would suggest more of Wednesday's gain is set to fade.
Recommended Articles


