


Gold Price Analysis Today | Forex Gold Analysis | XAU/USD Analysis - November 19, 2026

Today's Gold Price
Gold price chart for today
*0% Commission and Low Spreads 0️⃣
*$50,000 in Free Virtual Funds 💰
*$100 New Customer Bonus 🎁
Gold (XAU/USD) rebounded slightly to around $3,744.37 this morning (November 19, 2026) after breaking below $3,750 and touching a 14-month low of $3,719.10. Hawkish FOMC minutes reinforced the prospect of tighter monetary policy, pushing the probability of a December rate hike to 95% and lifting the dollar to its highest level since April 2025. Renewed tensions in Hormuz failed to offset pressure on precious metals as oil prices fell sharply. Today's focus is whether gold can clear $3,787–3,797 to ease near-term pressure.
Today's Key Points
| Key Points |
|
|
|
Gold plunges below $3,750 to a 14-month low as FOMC minutes lift December hike odds to 95%
U.S. spot gold fell $125.90 (-3.27%) to around $3,722.60 per ounce after touching $3,719.10, its lowest level since September 2025. It recovered slightly to around $3,744.37 this morning. Silver fell even more sharply, losing $2.340 (-4.95%) to close near $44.930, below $45.000, amid concerns over slowing industrial demand and tight financial conditions.
The main pressure came from the minutes of the October 27–28 FOMC meeting. Almost all participants expected further rate increases in December, and two discussed a larger 50 bps hike. The probability of a 25 bps increase at the December 8–9 meeting rose to 95%, while the dollar climbed to 103.82, its highest level since April 2025. The 10-year Treasury yield nevertheless eased to around 5.065%, and the 2-year yield closed at 4.798%. October housing data were mixed: Housing starts rose 9.9%, building permits fell 7.4%, and pending home sales dropped 4.7% to their lowest level since 2001.
Renewed Hormuz tensions fail to support safe-haven demand as oil falls 3.2% on rising U.S. inventories
Tensions in the Strait of Hormuz escalated as Iran expanded drone attacks on U.S. bases in Kuwait and Bahrain in response to strikes on Qeshm Island. An attack on an Abu Dhabi oil company vessel left 1 crew member missing and 11 injured, while a tanker near Oman caught fire after being fired on, amid the U.S. naval blockade.
Despite the escalating conflict, oil fell sharply after the EIA reported that U.S. crude inventories rose 3.4 million barrels to 417.8 million barrels, well above the expected increase of 58,000 barrels. Gasoline inventories increased 5.2 million barrels. WTI dropped 3.2% to close at $83.26, and Brent fell 1.3% to $91.95. Fed rate pressure and the stronger dollar consequently outweighed safe-haven buying in gold.
Mining shares and European stocks follow commodities lower, with U.S. labor data in focus tonight
U.S. and European stocks mostly closed lower, led by mining and energy shares. The Dow Jones fell 561.25 points (-1.1%) to 50,198.17, and the S&P 500 declined 0.2% to 7,323.63, extending its losing streak to 5 days. The Nasdaq rose 0.4% after Nvidia reported better-than-expected earnings, although selling pared its gains. Canada's materials sector and Europe's Stoxx 600 fell sharply, by 5% and 1.03%, respectively.
Some money flowed into Treasuries, pushing the 10-year yield down to around 5.07%. Institutions nevertheless continued to reduce commodity and precious-metal holdings to raise cash amid tight interest-rate conditions. Tonight's unemployment claims and Philadelphia Fed index are due at 20:30. Weak readings could slow the dollar and support a gold rebound.



Technical Analysis of Gold (XAU/USD)
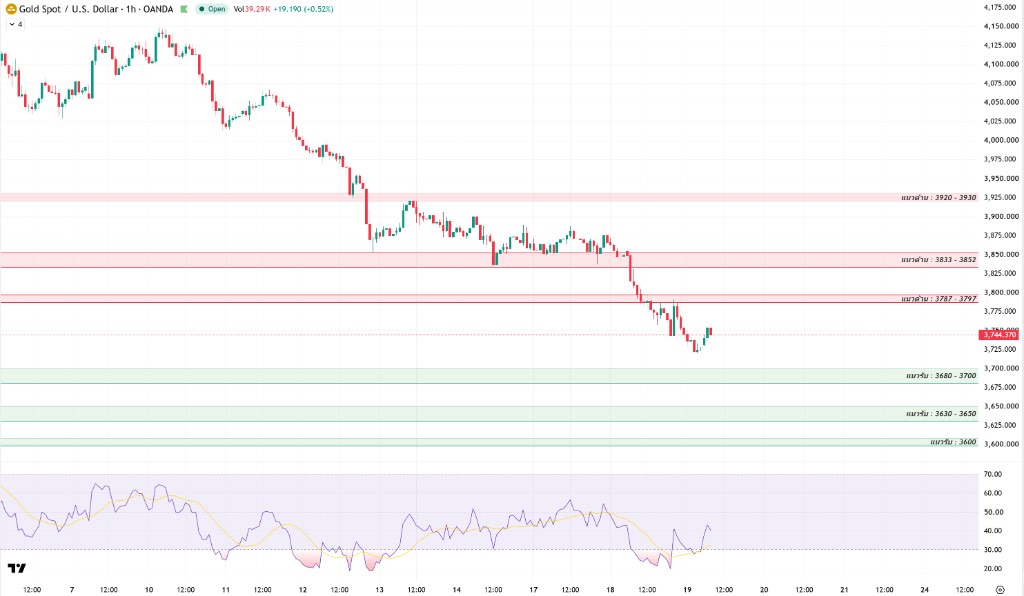
On the 1-hour chart, gold remains in a clear downtrend, with successive lower highs from $4,140–4,150 to $3,920–3,930 and $3,875. It then broke below support at $3,833–3,852 and $3,787–3,797 to make a new low, leaving a candle wick that tested liquidity near $3,719–3,720. Buying absorbed some selling this morning, lifting gold back toward $3,744.37.
The 1-hour RSI fell deep into oversold territory near 21–23 and began to stabilize as gold touched $3,719–3,720. It has since rebounded above 30 and crossed above its yellow moving average at 32 to reach around 40–41. This signals a short-term recovery, although RSI remains below 50.
Today's key test is whether gold can form a higher low above $3,719–3,720, move through $3,750 and reclaim initial resistance at $3,787–3,797. Otherwise, the rebound could still prove to be a bull trap before renewed selling.
If gold holds firmly at $3,719–3,720 and reclaims $3,787–3,797, it could recover further toward $3,833–3,852 and $3,920–3,930. A 1-hour close below $3,719.10, however, would confirm a decline toward the major support zones at $3,680–3,700, $3,630–3,650 and $3,600, in that order.
Today's Gold Price Outlook
| Scenarios |
|
|
|
Today's Trading Strategy
For short-term traders: Trade the range with discipline. Avoid chasing prices during post-FOMC volatility, watch how gold responds at key zones, and always use a stop-loss.
- Buy setup: Wait for a pullback that holds $3,719–3,720 or $3,680–3,700 and produces a clear reversal candle, or follow the move after a close above $3,797. The target is $3,833–3,852, with a stop-loss below the key support zone.
- Sell setup: Look to sell if a rebound fails at $3,787–3,797 or $3,833–3,852, or follow the move after a close below $3,719.10. Targets are $3,680–3,700 and $3,630–3,650, with a stop-loss above resistance.
For longer-term holders: A 95% probability of a Fed hike continues to pressure gold in the near term. Delay accumulation and wait for a clear base around $3,680–3,700 or $3,600–3,650 and a move above $3,797 before gradually buying.
Daily Support and Resistance Levels
| Type | Price Level |
| Support #1 | $3,680–3,700 |
| Support #2 | $3,630–3,650 |
| Support #3 | $3,600 |
| Resistance #1 | $3,787–3,797 |
| Resistance #2 | $3,833–3,852 |
| Resistance #3 | $3,920–3,930 |
Today's Questions (FAQ)
Why did the FOMC minutes send gold and silver sharply lower?
The October minutes showed that almost all Fed participants expected further rate increases in December, with some considering 50 bps. Hike odds rose to 95%, while the dollar reached a 19-month high, increasing the cost of holding non-interest-bearing gold.
Why hasn't gold benefited from safe-haven demand despite escalating tensions in the Strait of Hormuz?
War risks increased, but a 3.4 million-barrel rise in U.S. crude inventories drove WTI down 3.2%. Investors also sold across asset classes to reduce risk and hold dollars and bonds amid rising interest rates, keeping gold under pressure in the near term.
Read more
The above content was completed with the assistance of AI and has been reviewed by an editor.


