


Gold Price Analysis Today | Forex Gold Analysis | XAU/USD Analysis - November 18, 2026


Today's Gold Price
Gold price chart for today
*0% Commission and Low Spreads 0️⃣
*$50,000 in Free Virtual Funds 💰
*$100 New Customer Bonus 🎁
Gold (XAU/USD) fell below $3,835 to trade near $3,818.67 this morning (November 18, 2026). Markets continued to price in a 94% chance of a December Fed rate hike, while global tech stocks sold off and U.S. economic data were mixed. Although the 10-year Treasury yield eased to 5.10% and tensions in the Strait of Hormuz intensified, selling across asset classes continued to pressure precious metals. Today's focus is whether gold can hold $3,815–3,835.
Today's Key Points
| Key Points |
|
|
|
Gold breaks below $3,835 toward key support as December Fed hike bets reach 94%
U.S. spot gold closed little changed near $3,853.10 per ounce (-0.06%) after trading between $3,836 and $3,891.60. Selling resumed during the Asian morning, pushing gold down to test $3,818.67. Silver rebounded 1.01% to $47.330 on speculative dip-buying, even as the dollar retreated from its high, the 10-year Treasury yield eased to 5.10%, and the 2-year yield fell to 4.79%.
U.S. economic data were mixed. October retail sales rose 0.2%, slowing from 0.8%, but sales excluding autos grew 0.6%, above the 0.4% forecast. Industrial production contracted 0.4%, compared with an expected 0.1% increase, while capacity utilization fell to 76.4%. The mixed picture was insufficient to ease inflation concerns. Futures therefore priced in a 94% chance of a 25 bps Fed hike at the December 8–9 meeting and a 6% chance of a 50 bps hike. Markets are now watching housing starts and tonight's FOMC minutes.
U.S. and European tech stocks tumble as money flows into bonds, but gold faces risk-reduction selling
U.S. and European stocks extended their declines, led by technology and semiconductor shares amid concerns over AI valuations and restrictions on chip exports to China. The Dow Jones fell 849 points (-1.6%) to 50,759.42, the S&P 500 declined 1.0% to 7,340.53, the Nasdaq slipped 0.7% to 24,328.38, and the Russell 2000 dropped 1.5%. The Stoxx 600 fell 1.75%, led by a 2.08% decline in the DAX.
The key point for traders is that gold failed to recover and broke support this morning even as the equity sell-off drove money into bonds and pulled yields lower. This suggests institutions are reducing positions across asset classes to hold cash amid tight financial conditions. Portfolio-rebalancing sales are therefore outweighing safe-haven buying in the short term.
Renewed Hormuz tensions lift oil, while energy inflation keeps pressure on the Fed
U.S.-Iran tensions in the Strait of Hormuz flared again after Iranian drones struck U.S. radar facilities in Bahrain and the U.S. attacked missile bases on Qeshm Island. A merchant vessel was attacked again, leaving crew members missing. Commercial vessel traffic through the strait fell to 5 ships on Saturday from 31 a week earlier and came to a halt on Sunday.
The developments helped crude rebound modestly. Brent gained $0.70 (+0.76%) to close at $93.14, and WTI rose $0.29 (+0.34%) to $86.01, although the two benchmarks were still down 20% and 16%, respectively, in November on expectations of oversupply. For gold, higher oil prices support a war-risk premium, but they also reinforce inflation pressures and the Fed's need to raise rates.



Technical Analysis of Gold (XAU/USD)
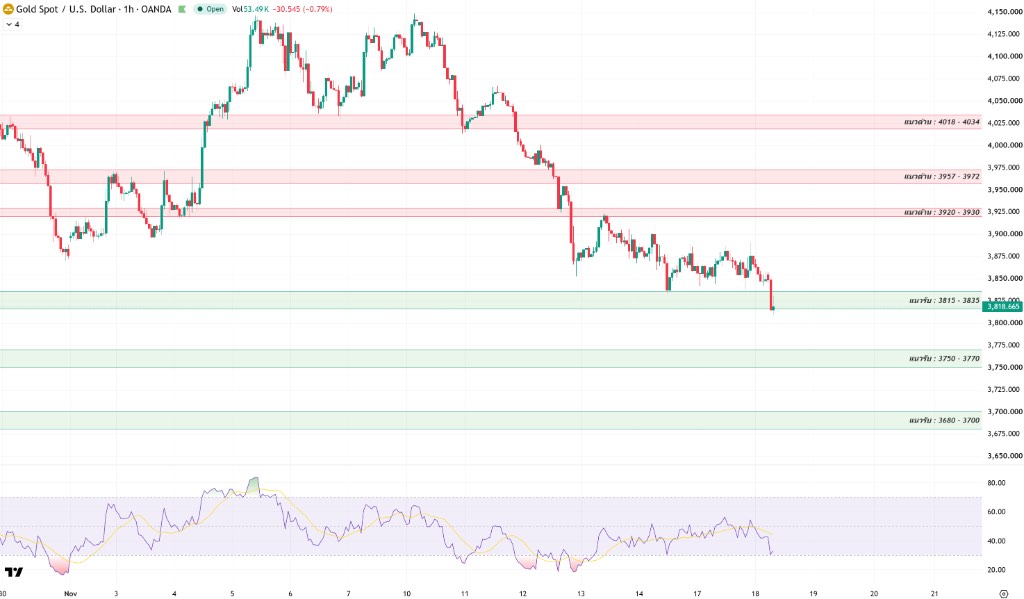
On the 1-hour chart, gold remains in a clear downtrend, with successive lower highs from $4,140–4,150 to $3,922, $3,900 and $3,891. On the morning of November 18, it broke below former support at $3,835 and tested $3,815–3,835 near $3,818.67, with a candle wick probing close to $3,810 to check liquidity.
The 1-hour RSI fell from near 50 toward oversold territory around 30–32 and crossed below its yellow moving average near 43–44. This points to strong short-term selling pressure, although conditions near oversold territory could allow intermittent technical rebounds.
Today's key test is whether gold can hold $3,815–3,835 and form a higher low above the current swing low. Any rebound needs to clear $3,850–3,855 and $3,888–3,898 before attempting to reclaim major resistance at $3,920–3,930. Otherwise, an intraday bounce could simply become a bull trap.
Holding above $3,815–3,835 and reclaiming $3,920–3,930 would open the way to a recovery toward $3,957–3,972 and $4,018–4,034. A 1-hour close below $3,815, however, would risk further declines toward the next support zones at $3,750–3,770 and $3,680–3,700.
Today's Gold Price Outlook
| Scenarios |
|
|
|
Today's Trading Strategy
For short-term traders: Stay disciplined and wait for signals at key zones. Avoid chasing short positions while RSI approaches oversold territory, watch for volatility around tonight's FOMC minutes, and always use a stop-loss.
- Buy setup: Wait for a pullback that holds $3,815–3,835 and produces a clear reversal candle, or look for support around $3,750–3,770. Targets are $3,855–3,892 and $3,920–3,930, with a stop-loss below $3,805.
- Sell setup: Look to sell if a rebound fails at $3,850–3,855, $3,888–3,898 or $3,920–3,930, or follow the move after a close below $3,815. The target is $3,750–3,770, with a stop-loss above $3,935.
For longer-term holders: A 94% probability of a December Fed hike continues to pressure gold in the near term. Slow the pace of averaging down, allow the market to absorb the FOMC minutes, and watch whether gold forms a base around $3,815 or $3,750–3,770 before accumulating.
Daily Support and Resistance Levels
| Type | Price Level |
| Support #1 | $3,815–3,835 |
| Support #2 | $3,750–3,770 |
| Support #3 | $3,680–3,700 |
| Resistance #1 | $3,920–3,930 |
| Resistance #2 | $3,957–3,972 |
| Resistance #3 | $4,018–4,034 |
Today's Questions (FAQ)
Why did gold break below $3,835 despite falling U.S. stocks and a drop in the 10-year Treasury yield to 5.10%?
The tech sell-off drove money into Treasuries and pulled the 10-year yield lower. But markets still priced in a 94% chance of a December Fed rate hike, while institutions sold across asset classes to reduce risk and hold cash, keeping gold under pressure.
How do clashes in the Strait of Hormuz and the oil rebound affect gold prices?
Tensions in the Strait of Hormuz support a war-risk premium and helped Brent rebound to $93.14. From a monetary policy perspective, however, recovering oil prices could prolong inflation and keep the Fed raising rates, limiting gold's near-term recovery.
Read more
The above content was completed with the assistance of AI and has been reviewed by an editor.


