Gold Hits Near 1.5-Year Low Below $3,800 as Bears Threaten Drop to $3,500

Mitrade
coverImg
Source: DepositPhotos

TradingKey - Gold prices broke below the $3,800 threshold to hit a new low since September 2025, warranting heightened vigilance over downside risk toward $3,500.

On November 18, international spot gold prices (XAUUSD) officially broke below the key psychological support level of $3,800 today after earlier intense volatility, falling to $3,784 per ounce to touch a low since September 2025. Pessimistic market sentiment toward precious metals has escalated rapidly as bearish momentum took full control, leaving the next major psychological and technical threshold of $3,500 exposed to selling pressure.

Over the past six months, international spot gold prices fluctuated downward from interim highs of around $4,500–$4,600 and officially broke below the psychological support level of $3,800 today, bringing the cumulative six-month pullback to approximately 16%. The core driver behind this six-month deep correction is that market pricing logic has shifted completely from early-year geopolitical safe-haven demand and monetary easing expectations toward resurgent inflation and monetary tightening.

Over the past six months, international crude oil prices surged past $110 per barrel to a four-year high amid tight Middle East supplies, keeping U.S. producer and consumer price indices elevated. Meanwhile, U.S. retail sales surged 6.8% year-over-year in October, hitting a four-year high and demonstrating resilient domestic demand.

Amid stickier-than-expected inflation and a hawkish tone from the new Federal Reserve Chair, the Fed not only resumed rate hikes in September with a 25-basis-point increase, but interest rate futures markets also repriced the risk of another rate hike over the next 12 months in the fourth quarter, directly stripping away the monetary easing fuel that had supported gold at elevated levels.

As tightening expectations mount, non-yielding gold faces an extremely severe opportunity cost test. The 10-year U.S. Treasury yield has steadily climbed and settled in a multi-year high range of 5.06% to 5.30%, allowing investors to earn a risk-free return of over 5% simply by holding Treasuries or U.S. dollar money market funds. This has significantly dampened institutional investors' appetite for non-yielding gold, sending gold prices lower.

Under macro pressure from rising expectations of Fed rate hikes, international spot gold officially broke below $3,800, a critical technical and psychological support level backed by strong market consensus. On the daily and weekly charts, the 50-day, 100-day, and 200-day moving averages have formed a clear bearish alignment and are sloping downward, capping the upside of every technical rebound. As long as gold fails to swiftly reclaim the $3,800 to $3,850 range on heavy volume, the momentum of the medium-term downward channel will continue to dominate price action.
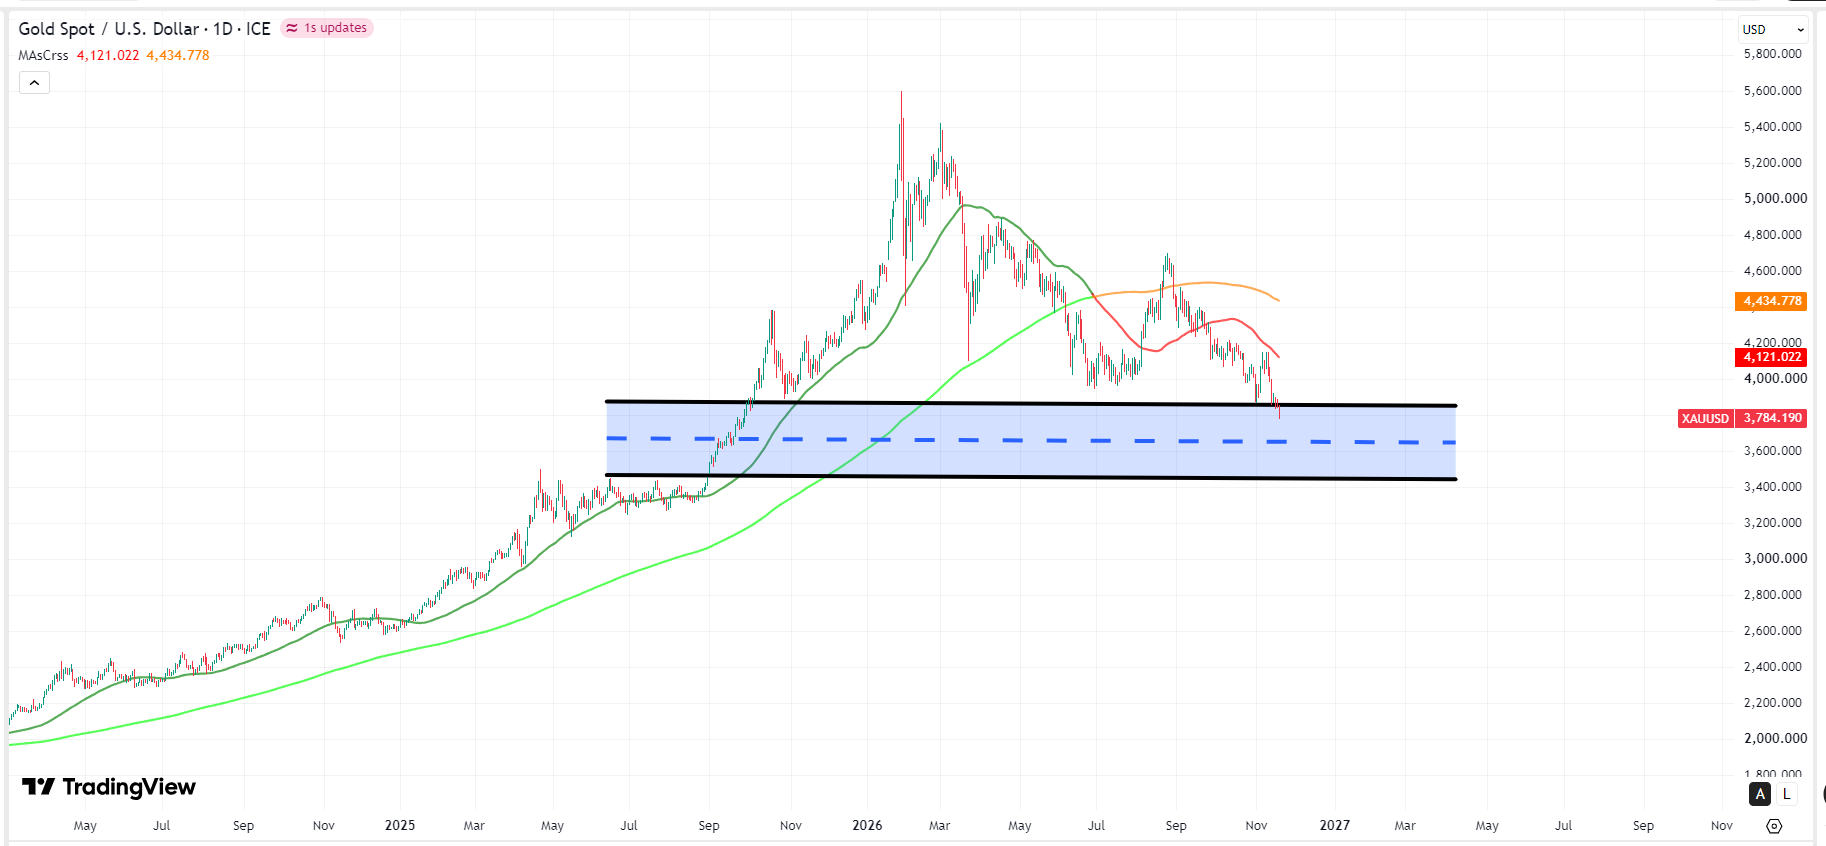
gold-xau-price-9c13b01770a14b138787d196618c1548Gold Price Chart, Source: TradingView

Judging from chart patterns and capital flows, this breakdown signals that the multi-month consolidation platform has failed, unleashing bearish momentum across the board. Technical indicators indeed point to the possibility that gold could test the $3,500 mark further to the downside in search of solid support.

Read more

  • Nvidia Q3 Earnings Loom as Market Expects Revenue Near $109 Billion: Can NVDA Stock Hold $150?
  • Australian Dollar declines below 0.6750 after RBA minutes, US Retail Sales data in focus
  • Bitcoin Plunges 13% in a Week as Market Retreats to $60,000 Level
  • * The content presented above, whether from a third party or not, is considered as general advice only.  This article should not be construed as containing investment advice, investment recommendations, an offer of or solicitation for any transactions in financial instruments.

    goTop
    quote
    Related Articles
    placeholder
    Gold Price Analysis Today | Forex Gold Analysis | XAU/USD Analysis - November 18, 2026Get the latest gold price analysis, forex gold insights, and XAU/USD analysis for November 18, 2026. Read on for the details.
    Author  Mitrade
    5 hours ago
    Get the latest gold price analysis, forex gold insights, and XAU/USD analysis for November 18, 2026. Read on for the details.
    placeholder
    Gold Price Forecast: Gold Holds Key $3,850 Support, US October Retail Sales May Drive Rebound Toward $4,000As of the Asian session on Tuesday (November 17), gold (XAUUSD) maintained a weak rebound intraday today after recent continuous declines to a nearly one-year low, edging up 0.2% during t
    Author  TradingKey
    23 hours ago
    As of the Asian session on Tuesday (November 17), gold (XAUUSD) maintained a weak rebound intraday today after recent continuous declines to a nearly one-year low, edging up 0.2% during t
    placeholder
    Gold Price Analysis Today | Forex Gold Analysis | XAU/USD Analysis - November 17, 2026Get the latest gold price analysis, forex gold insights, and XAU/USD analysis for November 17, 2026. Read on for the details.
    Author  Mitrade
    Yesterday 05: 40
    Get the latest gold price analysis, forex gold insights, and XAU/USD analysis for November 17, 2026. Read on for the details.
    placeholder
    Weekly Report: Gold's $4,000 reclaim and Brent's $100 break were right calls — the silver call was wrongLast week this report said gold's $4,000 reclaim was not the trend and that Brent's supply premium was over. Gold fell 4.7% to $3,884.69 and Brent fell 2.52% to $95.84, so both were right. The call that missed was silver: we read a gold-silver ratio of 78.7 as silver being cheap, and the ratio instead broke above 80 to 81.1 as silver fell 5.35%. This report grades the three calls, explains the miss, and sets this week's scorecard around 3,852 gold, 93.73 Brent and 6.00 copper.
    Author  Irene Q.
    Nov 16, Mon
    Last week this report said gold's $4,000 reclaim was not the trend and that Brent's supply premium was over. Gold fell 4.7% to $3,884.69 and Brent fell 2.52% to $95.84, so both were right. The call that missed was silver: we read a gold-silver ratio of 78.7 as silver being cheap, and the ratio instead broke above 80 to 81.1 as silver fell 5.35%. This report grades the three calls, explains the miss, and sets this week's scorecard around 3,852 gold, 93.73 Brent and 6.00 copper.
    placeholder
    Gold Price Analysis Today | Forex Gold Analysis | XAU/USD Analysis - November 16, 2026Get the latest gold price analysis, forex gold insights, and XAU/USD analysis for November 16, 2026. Read on for the details.
    Author  Mitrade
    Nov 16, Mon
    Get the latest gold price analysis, forex gold insights, and XAU/USD analysis for November 16, 2026. Read on for the details.
    Live Quotes
    Name / SymbolChart% Change / Price
    XAUUSD
    XAUUSD
    0.00%0.00
    XAGUSD
    XAGUSD
    0.00%0.00

    Gold Related Articles

    • 10 Best Day Trading Platforms for Beginners and Active Traders in 2026: A Practical Guide
    • What is Gold CFD? How to Trade Gold CFD With Mitrade Example
    • ​5 Best Paper Trading Platforms for 2026 (Free Demo Accounts for Beginners & Traders)
    • XAU/USD Gold Price Trend Analysis 2026: Will It Keep Rising?
    • Is Mitrade Right for You? A Complete Guide on How to Start Trading CFDs in 5 Steps
    • How and Where to Buy Gold in Australia? A Complete Guide for Beginners

    Click to view more