


Micron vs. Sandisk: The AI Memory Supercycle Is Big Enough for Both, but Here's the Better Buy.
Key Points
Micron is a leader in DRAM and NAND memory, while Sandisk is a pure-play NAND maker.
Both companies have been benefiting from surging memory prices.
- 10 stocks we like better than Micron Technology ›
Memory has been one of the biggest stories of 2026. Prices have surged as memory has become one of the biggest bottlenecks in the artificial intelligence (AI) build-out. This has impacted not just the cost of AI data centers, but also the cost of smartphones, PCs, and other electronic devices.
This has benefited the stocks of both Sandisk (NASDAQ: SNDK) and Micron (NASDAQ: MU), which have been two of the market's biggest winners this year. Sandisk shares are up over 200% this year, while Micron shares have soared around 150%.
Missed AI’s "Act 1"? Act 2 Could Be 15x Bigger. Most investors think they missed the AI boat because they didn't buy Nvidia in 2005. But according to our analysts, we’re only at the end of "Act 1"—the R&D phase. "Act 2" is the global rollout. Continue »
DRAM vs. NAND
While both Sandisk and Micron are important players in the memory market, they play very different roles. The memory market is broken down into two primary categories: volatile and nonvolatile. Volatile memory is used for temporary storage and loses all stored data when it loses access to power. The predominant type of this memory is dynamic random access memory (DRAM), which is extremely fast and serves as a short-term workspace for processors.
Nonvolatile memory, on the other hand, retains all its information when the power is turned off and is used for permanent storage. The most common type of nonvolatile memory is NAND (flash) memory. It is slower and much less expensive. This type of memory is used in solid-state drives (SSDs) and hard disk drives (HDDs), as well as in devices like memory cards.
Micron is the smallest of the big three DRAM makers, which together control approximately 90% of the DRAM market. It holds over 20% of the DRAM market and around 15% of the NAND market. Last quarter, it derived approximately 73% of its revenue from DRAM and 26% from NAND.
Sandisk, meanwhile, is a pure-play maker of NAND. It makes up just over 10% of the flash market.
The DRAM and NAND markets have both been surging, and there is some interconnection between the two, although the market dynamics are quite different. The overall memory market is currently being driven by a type of memory called high bandwidth memory (HBM). This is a special form of DRAM that gets packaged with graphics processing units (GPUs) and other AI accelerators to reduce latency and optimize the performance of these very expensive chips.
Demand for HBM is moving in lockstep with demand for AI accelerators, but supply has not kept pace. This is due to a few factors.
The first is that HBM is manufactured using the same extreme ultraviolet (EUV) lithography machines that make GPUs and other advanced logic chips. Since there is only one company in the world with this technology, ASML (NASDAQ: ASML), there is only so much new EUV capacity that can be added each year, and everyone is fighting over it. On top of that, HBM requires upward of three times the wafer capacity as conventional DRAM, and it takes years to build new cleanroom facilities.
This dynamic has led the big three DRAM makers, which also include Samsung and SK Hynix (NASDAQ: SKHY), to focus much of their resources on HBM at the expense of ordinary DRAM and NAND, causing all memory prices to surge. Conventional DRAM and NAND prices have actually soared more quickly than HBM prices, which has fueled Micron's and Sandisk's strong growth. Meanwhile, the NAND market is also seeing strong demand due to the need for AI labs to store their training data in massive flash-based SSDs.
Image source: The Motley Fool.
The better stock to buy
While both the DRAM and NAND markets are historically cyclical, with big boom and bust cycles, this time is clearly different, with AI as a powerful secular tailwind. Both companies have been locking up longer-term deals, and both stocks trade at extremely low forward price-to-earnings (P/E) ratios of 4 times or less.
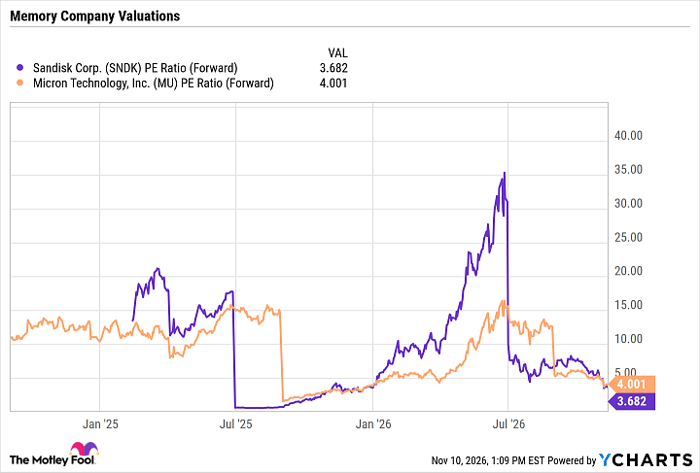
SNDK PE Ratio (Forward) data by YCharts
However, with far fewer players in the DRAM market than the NAND market, and the importance of HBM in the AI build-out, I think that Micron is the clear stock of the two to buy if you were only going to buy one, as I expect the current memory supercycle to last longer for DRAM.
Should you buy stock in Micron Technology right now?
Before you buy stock in Micron Technology, consider this:
The Motley Fool Stock Advisor analyst team just identified what they believe are the 10 best stocks for investors to buy now… and Micron Technology wasn’t one of them. The 10 stocks that made the cut could produce monster returns in the coming years.
Consider when Netflix made this list on December 17, 2004... if you invested $1,000 at the time of our recommendation, you’d have $341,157!* Or when Nvidia made this list on April 15, 2005... if you invested $1,000 at the time of our recommendation, you’d have $1,037,753!*
Now, it’s worth noting Stock Advisor’s total average return is 834% — a market-crushing outperformance compared to 207% for the S&P 500. Don't miss the latest top 10 list, available with Stock Advisor, and join an investing community built by individual investors for individual investors.
See the 10 stocks »
*Stock Advisor returns as of November 12, 2026.
Geoffrey Seiler has no position in any of the stocks mentioned. The Motley Fool has positions in and recommends ASML and Micron Technology. The Motley Fool has a disclosure policy.
Recommended Articles


