


AI stocks rebound and carry the NASDAQ 100 to a one-week high
- NASDAQ climbs to its highest since November 4, with SPX and DJIA also up.
- Nvidia rebounds 2.9%, and Anthropic sets an IPO worth up to $1.4 trillion.
- Six Fed officials speak Thursday before October producer prices on Friday.
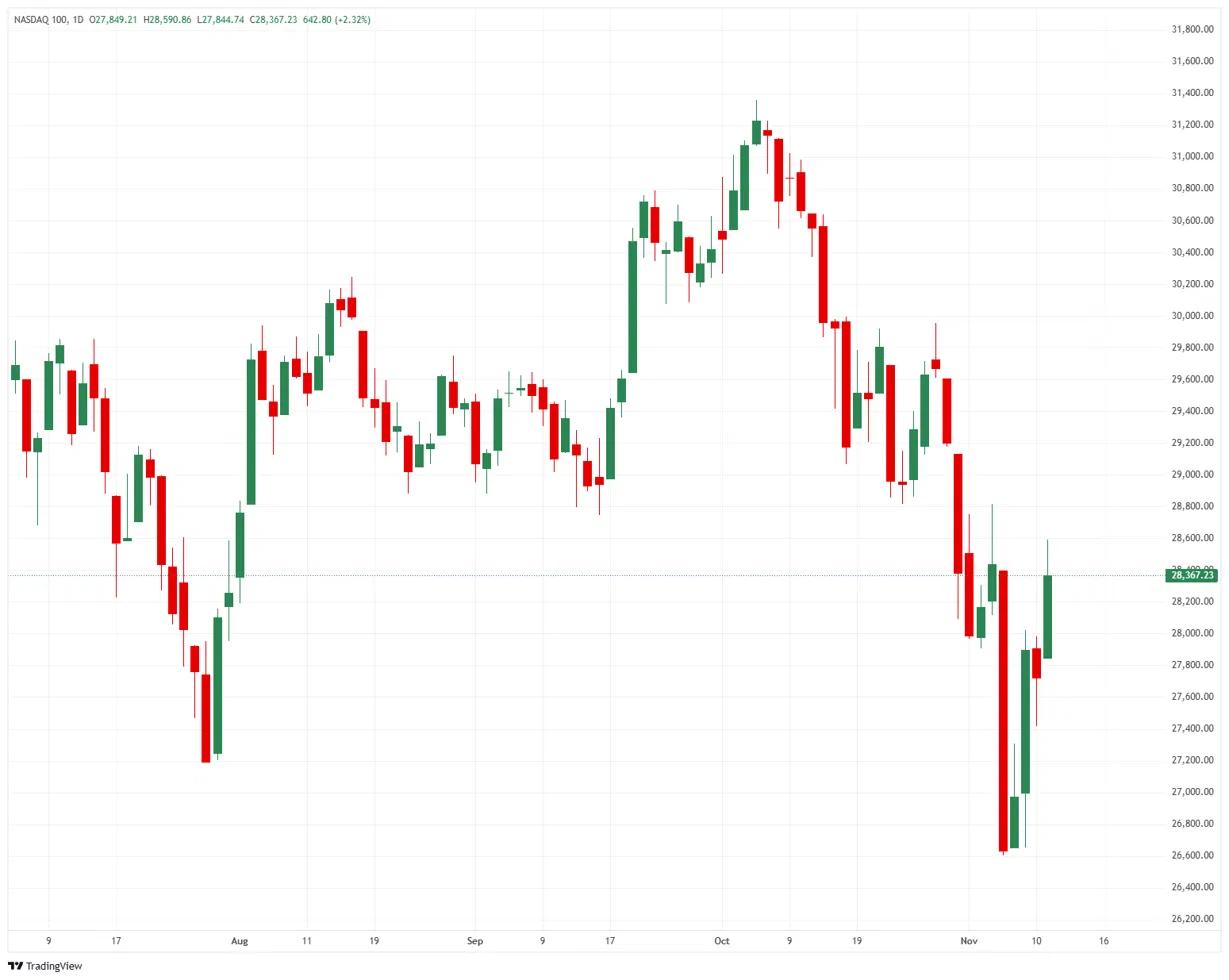
The more artificial intelligence (AI) a US index holds, the more of the fall that began on November 5 it has now recovered. The NASDAQ 100 touched just under 28,600, above where it started that session, and is trading near 28,400. The S&P 500, just above 7,600, has won back about four fifths of the fall, and the Dow Jones Industrial Average, near 52,500, about three fifths.
CoreWeave (CRWV) is up nearly 25% after third-quarter revenue beat forecasts and it raised its 2026 revenue and operating income guidance. CoreWeave Chief Executive Intrator told CNBC its data centre build plans aren't being delayed, the worry that started the November 5 selling. Anthropic's initial public offering (IPO), which could value it at up to $1.4 trillion and is reported several times oversubscribed, adds demand for the AI stocks that weigh most in the NASDAQ 100.
Nvidia (NVDA) is up 2.9% after losing nearly 10% over Monday and Tuesday. Morgan Stanley dropped it as a top pick on Wednesday and the House China panel gave Nvidia Chief Executive Huang until the end of the business day to respond, and the stock rose anyway. Traders still put a quarter-point Fed hike in December near 90%, but the Treasury market is shut for Veterans Day, so no yields rose against the stock rally.
On the calendar
Six Fed officials speak on Thursday, from Cleveland Fed President Hammack at 14:00 GMT to New York Fed President Williams at 23:30 GMT. Hammack voted to raise rates in October, and with a quarter-point move on December 9 priced as close to certain, the speeches bear on whether it could be a half-point.
Initial jobless claims come at 13:30 GMT on Thursday, with 195K forecast after 189K. October's Producer Price Index (PPI) is due at 13:30 GMT on Friday, forecast up 0.4% on the month after 1.3% and up 6.6% on the year after 6.3%.
On the charts
The NASDAQ 100 has recovered more than a third of its fall from the October 6 high near 31,350 to the November 5 low near 26,600. The S&P 500 has recovered more than half of its drop from just below 7,850. The Dow Jones Industrial Average didn't fall with them in October: it climbed from near 50,500 on October 1 to just under 53,800 on November 5, and it's about 1,300 points under that high.
Nasdaq 100 index, daily
Nasdaq FAQs
The Nasdaq is a stock exchange based in the US that started out life as an electronic stock quotation machine. At first, the Nasdaq only provided quotations for over-the-counter (OTC) stocks but later it became an exchange too. By 1991, the Nasdaq had grown to account for 46% of the entire US securities’ market. In 1998, it became the first stock exchange in the US to provide online trading. The Nasdaq also produces several indices, the most comprehensive of which is the Nasdaq Composite representing all 2,500-plus stocks on the Nasdaq, and the Nasdaq 100.
The Nasdaq 100 is a large-cap index made up of 100 non-financial companies from the Nasdaq stock exchange. Although it only includes a fraction of the thousands of stocks in the Nasdaq, it accounts for over 90% of the movement. The influence of each company on the index is market-cap weighted. The Nasdaq 100 includes companies with a significant focus on technology although it also encompasses companies from other industries and from outside the US. The average annual return of the Nasdaq 100 has been 17.23% since 1986.
There are a number of ways to trade the Nasdaq 100. Most retail brokers and spread betting platforms offer bets using Contracts for Difference (CFD). For longer-term investors, Exchange-Traded Funds (ETFs) trade like shares that mimic the movement of the index without the investor needing to buy all 100 constituent companies. An example ETF is the Invesco QQQ Trust (QQQ). Nasdaq 100 futures contracts allow traders to speculate on the future direction of the index. Options provide the right, but not the obligation, to buy or sell the Nasdaq 100 at a specific price (strike price) in the future.
Many different factors drive the Nasdaq 100 but mainly it is the aggregate performance of the component companies revealed in their quarterly and annual company earnings reports. US and global macroeconomic data also contributes as it impacts on investor sentiment, which if positive drives gains. The level of interest rates, set by the Federal Reserve (Fed), also influences the Nasdaq 100 as it affects the cost of credit, on which many corporations are heavily reliant. As such the level of inflation can be a major driver too as well as other metrics which impact on the decisions of the Fed.
Recommended Articles


