

Gold Tumbles Toward $4,000 as Hotter-Than-Expected CPI Boosts Fed Rate-Hike Bets, Bulls Eye $3,975 Support

Mitrade
coverImg
Source: DepositPhotos

TradingKey - As of the Asian session on Wednesday (November 11), gold prices (XAUUSD) rebounded slightly after a sharp decline in the previous session, last trading near $4,040, up about 0.3% on the day. Earlier, the latest U.S. CPI released on Tuesday came in higher than market expectations, lifting the U.S. dollar and Treasury yields and putting short-term pressure on gold. Gold prices fell 2.61% that day, dropping to a low of $4,013.54 and approaching the $4,000 mark.

Fed December Rate Hike Expectations Rise Further as US October Core CPI Tops Estimates

Data released by the U.S. Bureau of Labor Statistics on Tuesday showed that U.S. headline CPI rose 0.4% month-over-month in October, exceeding market expectations of 0.3% but slowing from 0.6% in September, while core CPI rose 0.3% month-over-month, also above the market expectation of 0.2%. Although the pace of headline inflation eased from September, core inflation continued to show stickiness, indicating that underlying U.S. price pressures have not yet significantly abated.

Following the data release, markets swiftly adjusted their expectations for Federal Reserve monetary policy. Previously, Fed official Christopher Waller stated that he would support more aggressive policy action by the central bank if inflation data came in significantly higher than expected. After the CPI release, markets fully priced in the likelihood of a 25-basis-point rate hike by the Fed in December, while the probability of a 50-basis-point hike in December rose from 0% previously to about 10%.

Impacted by this, the U.S. Dollar Index rose about 0.56% to near 102.25. The U.S. 2-year Treasury yield rose about 18.44 basis points to 4.731%, and the 10-year Treasury yield climbed about 12.55 basis points to 4.988%.

A stronger dollar and rising U.S. Treasury yields were the primary reasons for gold's sharp decline following the CPI release. The dollar's gain raised the cost of gold for buyers holding other currencies, while higher Treasury yields increased the opportunity cost of holding non-yielding gold, jointly exerting downward pressure on gold prices.

Recent data also indicate that the U.S. labor market has shown strong resilience. Nonfarm payrolls increased by 165,000 in October, well above market expectations of 65,000, while the unemployment rate fell to 4.1%. The robust labor market, coupled with higher-than-expected core inflation, leaves the Fed with little justification to pivot toward an accommodative policy in the near term.

Gold Price Technical Analysis
gold-e861d450cb0944a687cb760fae952608

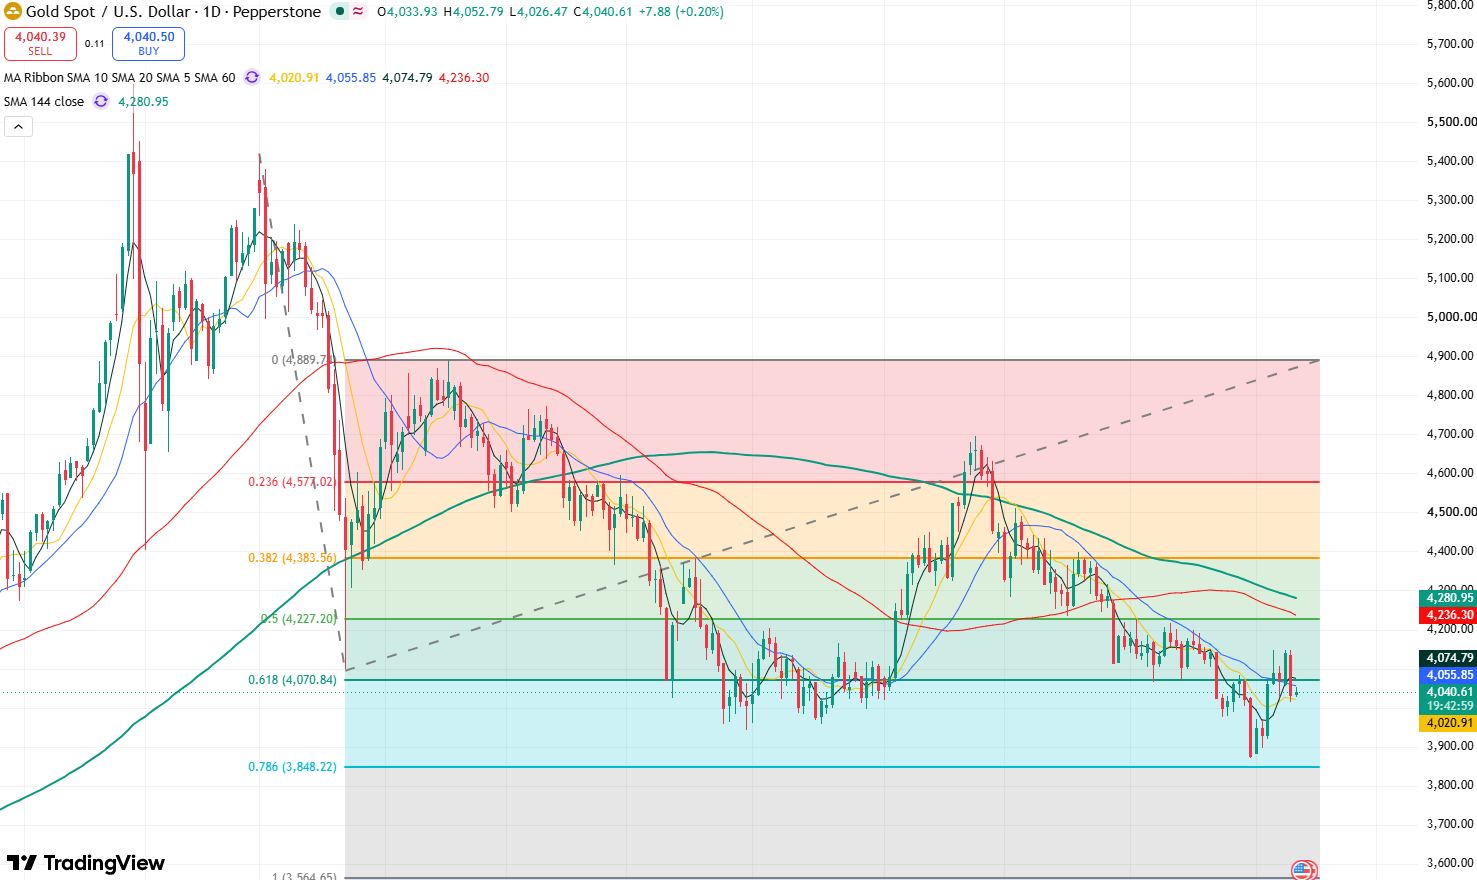
Gold price daily chart, Source: TradingView

On the daily chart, gold had previously rebounded sharply from near $3,870 to around $4,148, but met resistance in the $4,150 resistance zone. Following a higher-than-expected US October CPI, gold retreated rapidly on Tuesday, falling back below $4,050, with earlier rebound momentum noticeably waning.
goldh-44830156d4ae464f87078f808ed7dea0

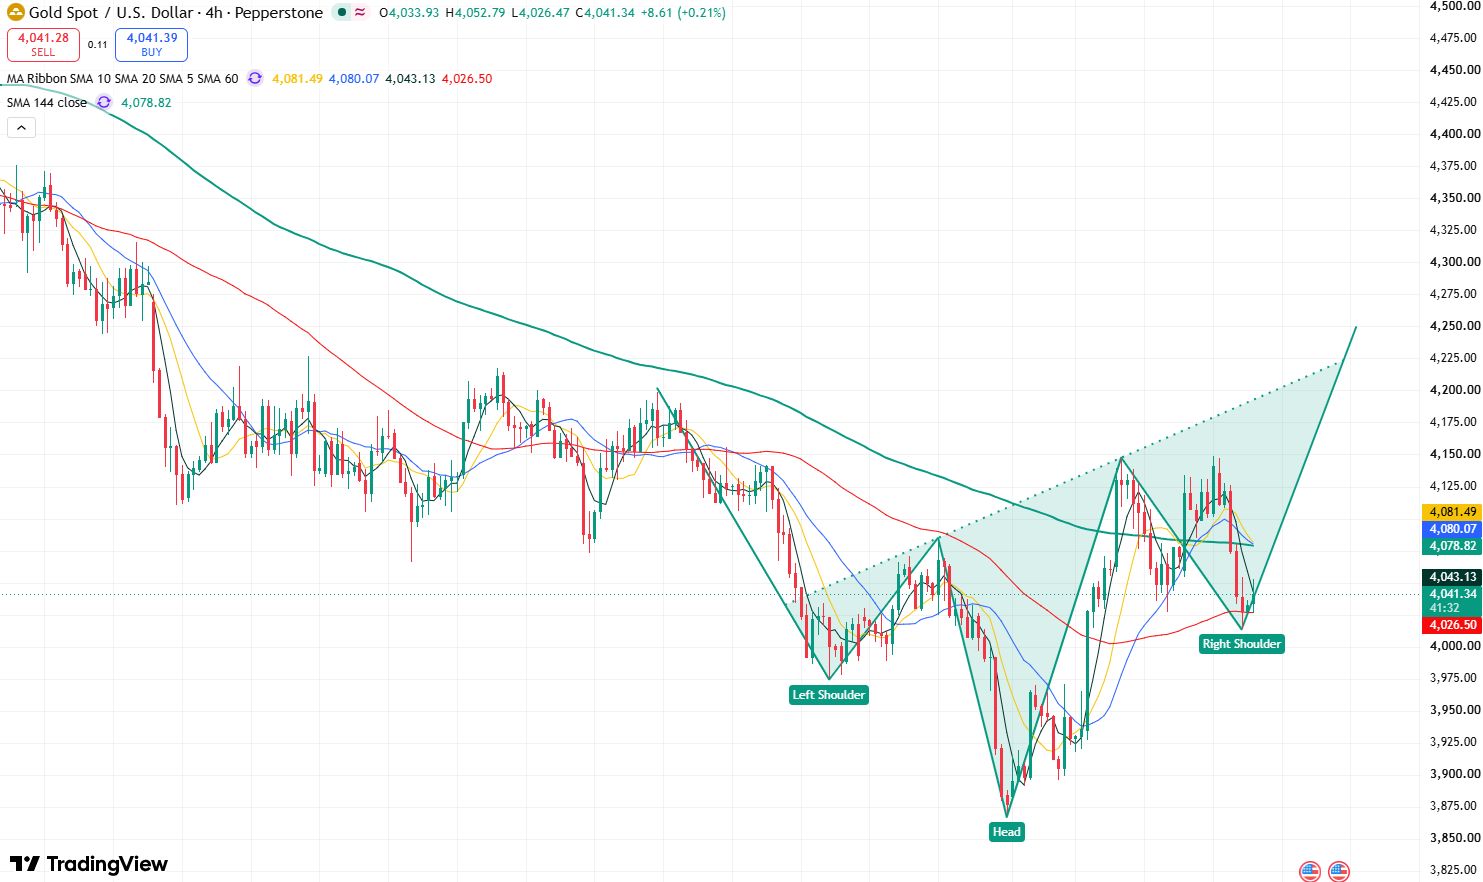
Gold price 4-hour chart, Source: TradingView

On the 4-hour chart, gold briefly broke above the October 28 rebound high of $4,082.89 during its previous strong rally, improving the short-term bullish structure while candlestick patterns suggest the potential formation of a head-and-shoulders bottom.

Currently, key attention should be paid to whether gold, weighed down by the bearish CPI impact, will break below the head-and-shoulders bottom's left-shoulder low of $3,975.48. If this level holds, the candlestick structure will form a head-and-shoulders bottom, significantly boosting short-term bullish momentum, with the primary upside target testing $4,200.

For now, the primary overhead resistance to watch is $4,150. A breakout above this level would open upside room toward $4,200–$4,230, with the $4,260–$4,300 resistance zone lying further above.

On the downside, the primary support to monitor is the $4,013–$4,000 range. If gold drops below $4,000, focus will shift to $3,975.48 below; if this level fails to hold, gold will retreat further toward $3,900.

Read more

  • US October PPI Preview: Fed Rate Hike Expectations Rise, PPI May Be Key Variable; How Will US Stocks, Dollar, and Gold Move?
  • Gold Extends Slide Below $4,000 as Rising US Inflation, Fed December Hike Bets Pressure Prices
  • * The content presented above, whether from a third party or not, is considered as general advice only.  This article should not be construed as containing investment advice, investment recommendations, an offer of or solicitation for any transactions in financial instruments.

    goTop
    quote
    Related Articles
    placeholder
    Gold Price Forecast: Gold Tumbles Below $3,900 as Trump Says No Need for Iran Deal; Can October PPI Spur a Rebound? As of the Asian session on Friday (November 13), gold prices (XAUUSD) rebounded intraday following Thursday's sharp decline, trading near $3,910. Previously, gold tumbled 2.76% on Thursda
    Author  TradingKey
    2 hours ago
    As of the Asian session on Friday (November 13), gold prices (XAUUSD) rebounded intraday following Thursday's sharp decline, trading near $3,910. Previously, gold tumbled 2.76% on Thursda
    placeholder
    Gold hit a one-year low while central banks bought 321 tonnes — the sellers were never the ones you thinkSpot gold closed at 3,876 on Thursday, down 2.8% and its lowest close in more than a year, with an intraday low near 3,852. The dollar is at a 19-month high of 103.21 and the 10-year yield is at 5.10%, so the price move is easy to explain. What is harder to explain is who sold: central banks bought 321 tonnes in Q3, the PBoC added for a 24th straight month, ETF holdings are near a record 4,256 tonnes, and roughly 95% of the futures selling came from non-reportable and sovereign-type accounts rather than hedge funds. This piece separates the two books that have to balance.
    Author  Irene Q.
    6 hours ago
    Spot gold closed at 3,876 on Thursday, down 2.8% and its lowest close in more than a year, with an intraday low near 3,852. The dollar is at a 19-month high of 103.21 and the 10-year yield is at 5.10%, so the price move is easy to explain. What is harder to explain is who sold: central banks bought 321 tonnes in Q3, the PBoC added for a 24th straight month, ETF holdings are near a record 4,256 tonnes, and roughly 95% of the futures selling came from non-reportable and sovereign-type accounts rather than hedge funds. This piece separates the two books that have to balance.
    placeholder
    US October PPI Preview: Fed Rate Hike Expectations Rise, PPI May Be Key Variable; How Will US Stocks, Dollar, and Gold Move?On Friday (Nov. 13) Eastern Time, the U.S. will release the October Producer Price Index (PPI). Following the October CPI once again exceeding expectations, the market will look to the PP
    Author  TradingKey
    Yesterday 08: 36
    On Friday (Nov. 13) Eastern Time, the U.S. will release the October Producer Price Index (PPI). Following the October CPI once again exceeding expectations, the market will look to the PP
    placeholder
    Gold closed below $4,000 again — the ETF crowd and central banks stayed, the momentum money leftSpot gold is trading near $3,999, its third consecutive lower daily low, after a 5.00% 10-year yield and a 102.85 dollar index raised the odds of a December hike to 87%. But the selling is not coming from the strategic holders: managed-money net longs fell to 324 tonnes, a 21-week low, and Goldman Sachs attributes roughly 95% of five weeks of selling to non-reportable positions. ETFs still hold a record 4,256 tonnes and central banks bought 321 tonnes in Q3. The table below sets the triggers, directions and levels.
    Author  Irene Q.
    Yesterday 03: 20
    Spot gold is trading near $3,999, its third consecutive lower daily low, after a 5.00% 10-year yield and a 102.85 dollar index raised the odds of a December hike to 87%. But the selling is not coming from the strategic holders: managed-money net longs fell to 324 tonnes, a 21-week low, and Goldman Sachs attributes roughly 95% of five weeks of selling to non-reportable positions. ETFs still hold a record 4,256 tonnes and central banks bought 321 tonnes in Q3. The table below sets the triggers, directions and levels.
    placeholder
    Gold Extends Slide Below $4,000 as Rising US Inflation, Fed December Hike Bets Pressure Prices On November 12, gold prices (XAUUSD) extended their recent losses, falling further below $4,000 in early Asian trading to hit an intraday low near $3,968, marking a third consecutive day
    Author  TradingKey
    Yesterday 02: 00
    On November 12, gold prices (XAUUSD) extended their recent losses, falling further below $4,000 in early Asian trading to hit an intraday low near $3,968, marking a third consecutive day
    Live Quotes
    Name / SymbolChart% Change / Price
    XAUUSD
    XAUUSD
    0.00%0.00
    XAGUSD
    XAGUSD
    0.00%0.00

    Gold Related Articles

    • 10 Best Day Trading Platforms for Beginners and Active Traders in 2026: A Practical Guide
    • What is Gold CFD? How to Trade Gold CFD With Mitrade Example
    • ​5 Best Paper Trading Platforms for 2026 (Free Demo Accounts for Beginners & Traders)
    • XAU/USD Gold Price Trend Analysis 2026: Will It Keep Rising?
    • Is Mitrade Right for You? A Complete Guide on How to Start Trading CFDs in 5 Steps
    • How and Where to Buy Gold in Australia? A Complete Guide for Beginners

    Click to view more