


Verizon Stock Forecast: VZ Holds Above $43.07 Into Q3 Earnings as SpaceX Eyes a Fourth Carrier
TradingKey - Verizon Communications (NYSE: VZ) reports third-quarter results before the open on Monday, October 26, with a webcast at 8:30 a.m. ET. The stock fell 1.19% to $44.66 on Friday, October 23, and premarket trading is nearly unchanged at $44.74.
Friday's drop followed a Bloomberg report that SpaceX is in talks to access at least 80,000 US cell sites, a step toward a fourth nationwide carrier. AT&T and T-Mobile each fell nearly 8% on the news, while Verizon lost only about 1%. That resilience gives today's report a clear job: show the subscriber growth needed to meet guidance.
The SpaceX Threat
Bloomberg said SpaceX is in talks with at least one major tower company, reportedly Crown Castle. The 80,000 sites equal about half of the roughly 158,500 purpose-built US cell towers. No lease has been signed, and Truist said the talks fall short of signed agreements and could be a negotiating tactic.
This is the second SpaceX shock this month. On October 9, the day after SpaceX agreed to buy nationwide low-band spectrum, reportedly worth about $8 billion, Verizon fell 8.75%, its worst day since 2002. SpaceX expects the spectrum deal to close in the first half of 2027 and plans to start service in early 2028. Even so, Verizon was still up about 18% this year before Friday.thi
What the Street Expects
Analysts expect adjusted EPS of about $1.27 to $1.28, up from $1.21 a year earlier, on revenue of about $34.81 billion to $34.86 billion, up from $33.82 billion. The EPS consensus has slipped from about $1.29 three months ago. Verizon beat EPS estimates in Q2 for the sixth straight quarter.
AT&T showed that results alone may not be enough. It beat revenue estimates and raised its outlook last week, yet its shares fell 6.5% afterward, a sign the SpaceX overhang is outweighing results across the sector.
Q2 Set the Bar
In July, adjusted EPS of $1.30 beat the $1.27 consensus. Postpaid phone net additions, new monthly bill-paying phone customers minus cancellations, reached 184,000, its best second-quarter consumer result in five years. Consumer postpaid phone churn, the share of customers who leave each month, fell to 0.84%, and the adjusted EBITDA margin, a measure of operating profit before interest, taxes and depreciation, hit a record 40.1%. Management raised full-year adjusted EPS guidance to $4.99 to $5.04 and lifted its buyback target to as much as $4.5 billion.
The Subscriber Math
Verizon expects 2026 postpaid phone net additions in the upper half of its 750,000 to 1 million range. It added 239,000 in the first half, so hitting the upper half needs roughly 636,000 to 761,000 in the second half. That makes Q3 net adds the first real test of the target, especially with a possible new competitor on the horizon.
Dividend and Valuation
Verizon pays $0.7075 per share each quarter, a yield of about 6.3% at Friday's close. Free cash flow, the cash left after operating costs and capital spending, is guided to $21.9 billion to $22.1 billion for 2026, with capex of $16 billion to $16.5 billion. The stock trades at about 8.5 times forward earnings.
Verizon Technical Analysis: Daily Close Above $45.71 Could Open $48.26
That SpaceX pressure is visible on the daily chart. The early-October drop, which included the 8.75% fall on October 9, pushed VZ toward the rising trendline, a line drawn under the stock's higher lows, and buyers stepped in quickly. Since then, VZ has climbed back above $43.07 support, a level where buying has stopped declines before. It still trades just below both moving averages, which track the average price over a set period and sit close together near $45.75, so this area is the next test before the report hits.
RSI, a momentum gauge that runs from 0 to 100, has improved to about 47. Momentum is recovering but remains neutral.
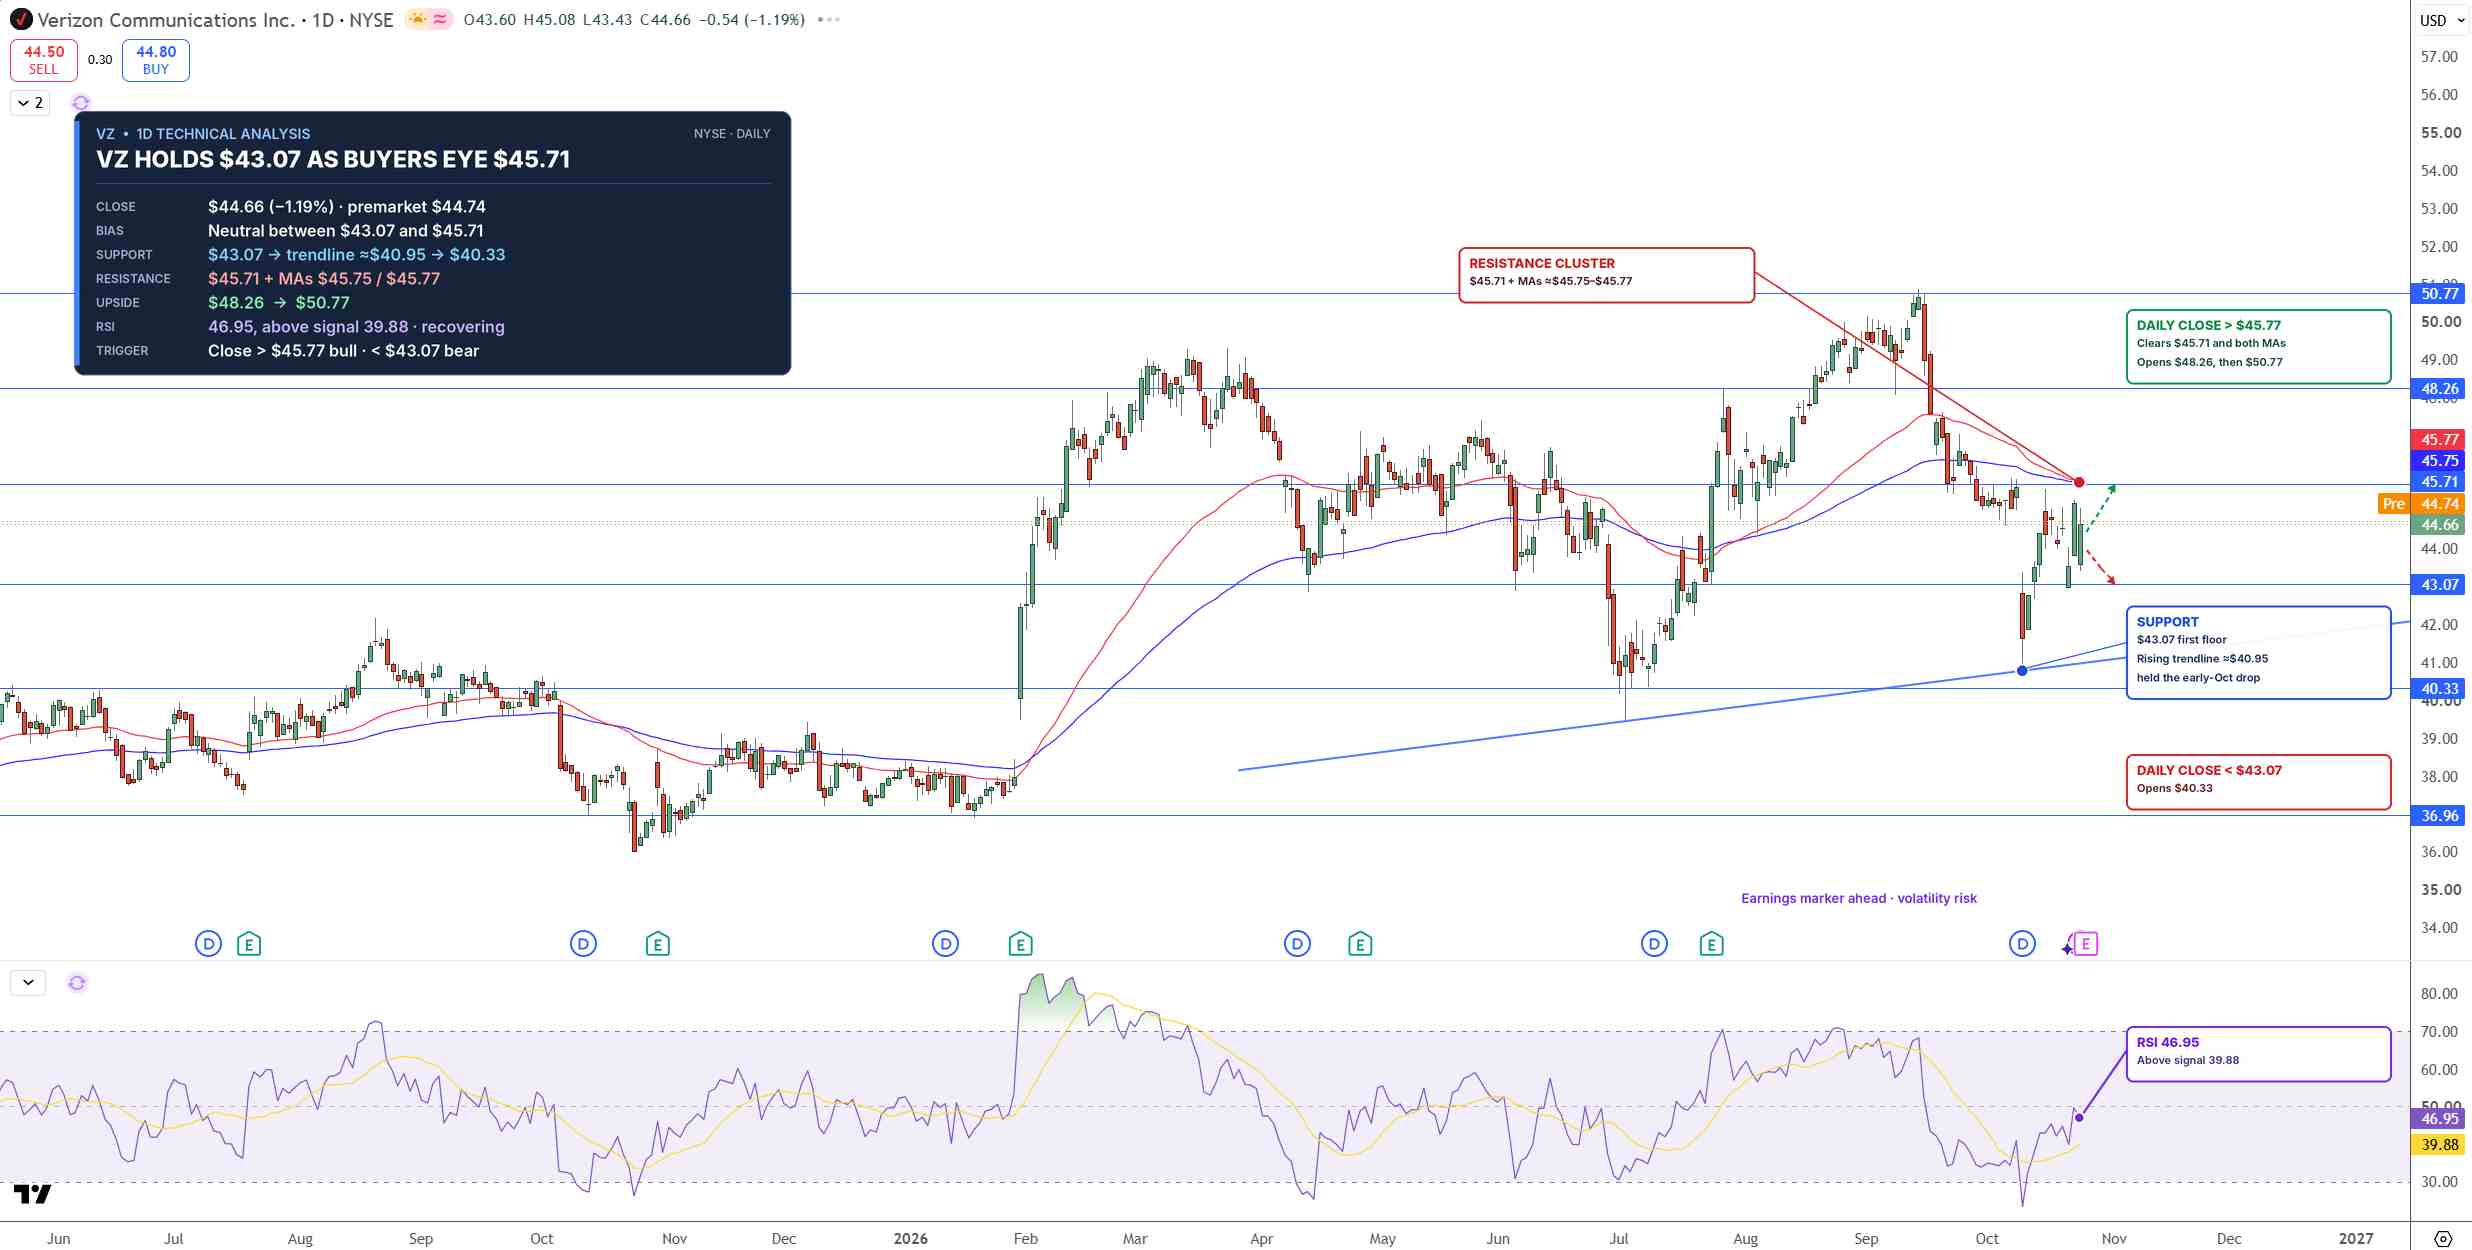
VZ Price Chart - Source: Tradingview
A daily close above $45.71 would put VZ back above its moving averages and open $48.26, then $50.77. On the downside, a close below $43.07 would open the way for $40.33.
I lean neutral while VZ trades between $43.07 and $45.71, with today's report likely to decide the break.
Key Levels
- Last close: $44.66, down 1.19% on October 23
- Support: $43.07, $40.33
- Resistance: $45.71, $45.75, $48.26, $50.77
- RSI: 46.95, just below the 50 midline
- Bullish trigger: Daily close above $45.71
- Bearish trigger: Daily close below $43.07
FAQs
When does Verizon report Q3 2026 earnings?
Verizon reports before the open on Monday, October 26, 2026, with a webcast at 8:30 a.m. ET. Analysts expect adjusted EPS of about $1.27 to $1.28 on revenue of about $34.81 billion to $34.86 billion.
What is the Verizon stock forecast before earnings?
The bias is neutral between $43.07 and $45.71. A daily close above $45.71 targets $48.26 and $50.77, while a close below $43.07 opens $40.33.
Bottom Line
Verizon has held up far better than its rivals against the SpaceX threat, but today's results need to show the subscriber growth that keeps guidance on track. The level that matters is $45.71, just under the moving averages. In my view, a daily close above it opens $48.26, while a drop below $43.07 would turn the picture bearish.
Recommended Articles


