

PLTR Stock Price Forecast: Stock Holds Above $200 and Hits Record High, Where Is the Next Target?

Source Tradingkey

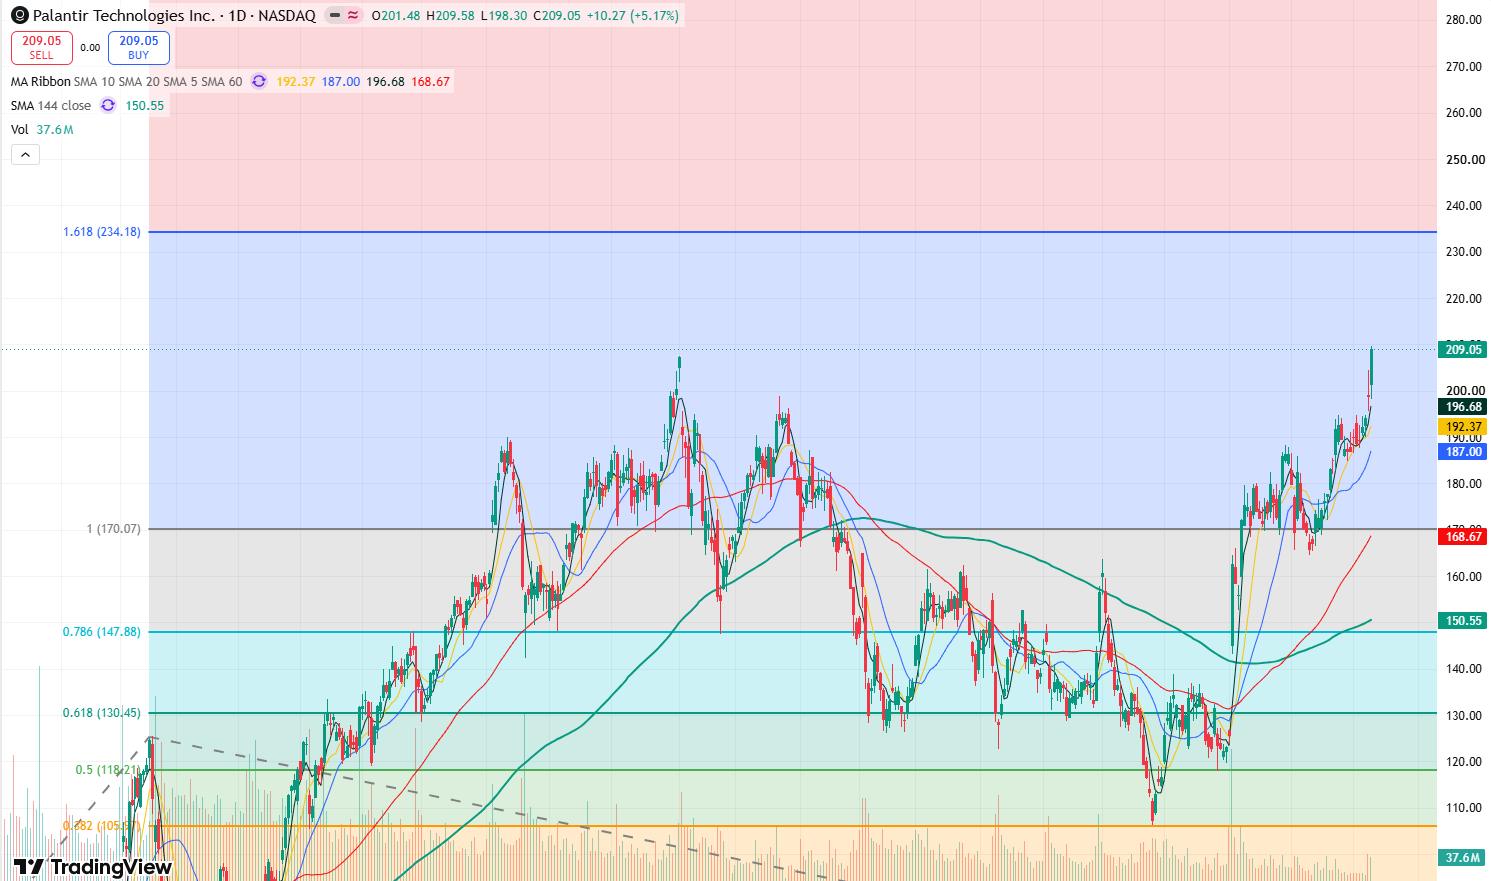
TradingKey - Palantir (PLTR) stock price has recently trended higher, further breaking through the $200 round-number mark on October 9. On that day, PLTR closed at $209.05, up 5.17%, reaching an intraday high of $209.58 to set a new record high, with a trading volume of approximately 37.58 million shares. Previously, the stock rose 2.40% on October 8, bringing the cumulative two-day gain to about 7.7%. Calculated from the closing price of $188.75 on October 2, PLTR gained roughly 10.8% over the following several trading days, with the short-term price center shifting noticeably upward.
pltr-ce95eab6fab144af928a38d5b6096e97

PLTR stock price daily chart, Source: TradingView

From the daily chart of PLTR stock price, the recent price movement shows a strong upward trend. As the stock price hits all-time highs, future upside potential is further unlocked, with the next target likely testing upward toward the Fibonacci 1.618 extension level near $234.

In terms of moving average structure, the current stock price is clearly running above the major short- to medium-term moving averages, and the 5-day, 10-day, and 20-day moving averages are aligned upward in sequence, indicating that the recent uptrend remains intact.

Regarding momentum indicators, the 14-day RSI is around 76, entering the overbought zone above 70 as defined by traditional technical indicators; the MACD stands at about 2.45 and remains positive, reflecting that current upward momentum persists, though price volatility may also increase after short-term gains expand.

Regarding upside resistance levels, $209.5–$210 is the primary resistance zone to watch currently, with $209.58 being the latest high. If trading volume can be sustained and the price holds firmly above $210, the next stage could focus on the round-number hurdles of $215 and $220, with potential to further rise toward $234; if breakout momentum is insufficient, the stock may retest near $200.

For downside support, the primary level to watch is $198–$200, corresponding to the October 8 closing area and the previous breakout position; further support lies at $192–$195, close to the 10-day moving average and recent high-volume trading zone. If the stock price falls below $190, the 20-day moving average near $187 will warrant further observation.

Disclaimer: For information purposes only. Past performance is not indicative of future results.
placeholder
Gold posts first weekly gain in three weeks — can $4,200 hold through CPI?Spot gold closed at $4,194.645, up 1.47% — its first weekly gain in three weeks — and COMEX futures settled back above $4,200 at $4,220.30. Here are the drivers, the levels and the scenarios into Wednesday's CPI.
Author  Irene Q.
11 hours ago
Spot gold closed at $4,194.645, up 1.47% — its first weekly gain in three weeks — and COMEX futures settled back above $4,200 at $4,220.30. Here are the drivers, the levels and the scenarios into Wednesday's CPI.
placeholder
US September CPI preview: inflation set to hit 3.7% — will the Fed hike in December?US September CPI lands Wednesday with headline inflation seen at 3.7% y/y and core at 0.2% m/m. December hike odds sit near 70% — here are the scenarios, the calendar and the key levels.
Author  Irene Q.
14 hours ago
US September CPI lands Wednesday with headline inflation seen at 3.7% y/y and core at 0.2% m/m. December hike odds sit near 70% — here are the scenarios, the calendar and the key levels.
placeholder
Gold Price Forecast: Gold Rebounds Above $4,200, Can Falling Oil Prices Drive Another Rally?As of Friday (October 9), gold prices (XAUUSD) rebounded noticeably after consecutive declines. During today's Asian session, gold prices briefly rebounded above $4,200, reaching an intra
Author  TradingKey
Yesterday 09: 23
As of Friday (October 9), gold prices (XAUUSD) rebounded noticeably after consecutive declines. During today's Asian session, gold prices briefly rebounded above $4,200, reaching an intra
placeholder
Hurricane Isaias has shut in a quarter of Gulf oil output — can WTI clear $92 before Thursday's EIA report?WTI trades at $90.80 after rebounding roughly 3% from Wednesday's $87.96 low as Hurricane Isaias — the Atlantic season's first — forces producers to shut in about 25% of US Gulf of Mexico output. Brent holds at $103.41. The first official read on the disruption arrives with the EIA weekly petroleum report on Thursday 15 October — here are the key levels and both scenarios.
Author  Irene Q.
Yesterday 06: 38
WTI trades at $90.80 after rebounding roughly 3% from Wednesday's $87.96 low as Hurricane Isaias — the Atlantic season's first — forces producers to shut in about 25% of US Gulf of Mexico output. Brent holds at $103.41. The first official read on the disruption arrives with the EIA weekly petroleum report on Thursday 15 October — here are the key levels and both scenarios.
placeholder
【Daily Brief】Gold rebounds 1% off a two-month low, Nasdaq drops 1.25% and yields ease — the storm premium keeps WTI near $91Gold trades at $4,174 after rebounding from Wednesday's $4,090 two-month low, the Nasdaq fell 1.25% while the Dow edged higher, and the 10-year Treasury eased to 5.23% from the week's highs. Hurricane Isaias keeps about 25% of Gulf output shut in with WTI near $91, and bitcoin holds below $82,000. The next scheduled tests are the EIA report on 15 October and the FOMC on 27-28 October.
Author  Irene Q.
Yesterday 06: 28
Gold trades at $4,174 after rebounding from Wednesday's $4,090 two-month low, the Nasdaq fell 1.25% while the Dow edged higher, and the 10-year Treasury eased to 5.23% from the week's highs. Hurricane Isaias keeps about 25% of Gulf output shut in with WTI near $91, and bitcoin holds below $82,000. The next scheduled tests are the EIA report on 15 October and the FOMC on 27-28 October.
goTop
quote