


How to Protect Your Portfolio as the Fed Raises Interest Rates
Key Points
A Federal Reserve tightening cycle was a catalyst for the last bear market.
However, after an initial pullback, something perhaps surprising happens.
Stocks generally perform well the following 12 months after rate increases.
- 10 stocks we like better than S&P 500 Index ›
The Federal Reserve recently hiked interest rates at its September meeting, and that is generally not good news for stocks. The Fed raised its target range by 25 basis points to 3.75%-4%, marking the first time it had increased the federal funds rate in more than three years as it looks to fight inflation.
Fed interest rate hikes are rarely one and done, and this looks like the start of a new tightening cycle. Fed Chair Kevin Warsh wants to return inflation to around 2%, noting that too many categories were running above 3%. Another rate increase is expected by year-end, and more could be coming in 2027.
Missed Nvidia in 2009? This Rare Signal Is Flashing Again. In 2009, a "Double Down" signal flashed for a little-known chipmaker called Nvidia. For the first time in years, that same "Total Conviction" signal is flashing for a company 1/100th the size of Nvidia. Continue »
Aside from four outliers who expect rate cuts in 2027, the Fed's dot plot shows the majority of Fed members expect rates to end 2027 between 4.25% and 4.5%.
The Fed's previous tightening cycle was a catalyst for the stock market's last bear market. The Fed began raising interest rates in March 2022 to fight inflation, which eventually led to a more than 25% decline in the S&P 500 (SNPINDEX: ^GSPC), with the index eventually troughing in October. Meanwhile, the five prior rate-hike cycles since 1994 saw the S&P 500 decline by 8% to 14%, according to RBC Wealth Management.
So what's an investor to do?
Don't panic
While a Fed rate-hiking cycle generally leads to initial declines in stock prices, the first thing investors should not do is panic. In fact, outside of the 2022 bear market, the S&P 500 produced positive returns in the 12 months following an initial rate hike in each of the other five tightening cycles. This includes a whopping 42% gain following a March 1997 rate hike. Overall, the average 12-month S&P 500 return following an initial rate hike is 6.7%.
Notably, the 2022 environment and the tightening cycle look very different from today. Following many years of extremely low rates, the Fed aggressively raised the interest rates by 525 basis points during that cycle. Investors were also growing increasingly fearful that a recession was imminent. The indication today is that the current Fed tightening cycle will be relatively short and mild, with the Fed dot-plot chart indicating only another 25 to 50 basis-point increase from here.
The better market comparison might actually be 1997, when stocks soared 42% over the next year following an initial rate hike. That was during the middle of the dot-com boom, while today we are in the midst of the artificial intelligence (AI) supercycle. If nothing else, that period shows us that optimism about game-changing technological innovation can trump rate-tightening cycles.
This cycle also comes with the bonus of taking place right before the midterm elections. The market's best performance historically comes after midterm elections, with the S&P 500 seeing gains 12 months following elections 95% of the time since 1938. Meanwhile, the index's average return during this period is a robust 14.5% since 1950.
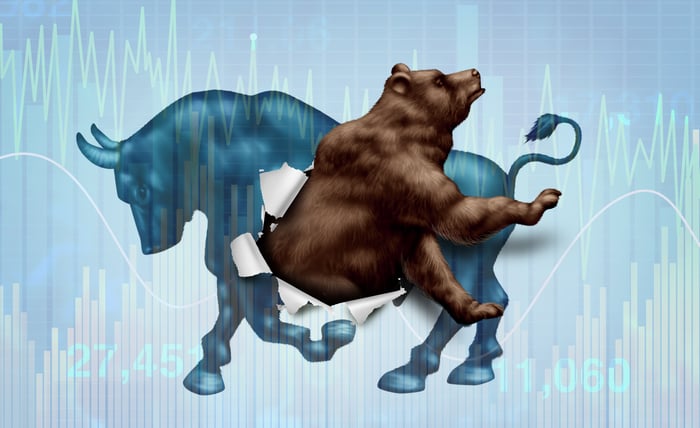
Image source: Getty Images.
How investors should prepare
If anything, past rate hike cycles have shown that initial downturns tend to be short, typically bottoming between a month and three and a half months later. Given that this is bumping into the historically strong post-midterm election period and during the AI boom, I'd expect any pullback to be on the shorter side.
Regardless, though, the smartest thing investors can do is stick to their core strategies. For me, this would be dollar-cost averaging into core index exchange-traded funds (ETFs) like the Vanguard S&P 500 ETF (NYSEMKT: VOO) and the Invesco QQQ Trust (NASDAQ: QQQ), which tracks the Nasdaq-100.
The simple truth is that market timing rarely works, and if you try, there is a good chance it will hurt your investment returns. The best proven way to build wealth over the long term is to dollar-cost average into core ETFs, and that is ultimately the best way to protect your portfolio.
Should you buy stock in S&P 500 Index right now?
Before you buy stock in S&P 500 Index, consider this:
The Motley Fool Stock Advisor analyst team just identified what they believe are the 10 best stocks for investors to buy now… and S&P 500 Index wasn’t one of them. The 10 stocks that made the cut could produce monster returns in the coming years.
Consider when Netflix made this list on December 17, 2004... if you invested $1,000 at the time of our recommendation, you’d have $361,650!* Or when Nvidia made this list on April 15, 2005... if you invested $1,000 at the time of our recommendation, you’d have $1,437,517!*
Now, it’s worth noting Stock Advisor’s total average return is 936% — a market-crushing outperformance compared to 211% for the S&P 500. Don't miss the latest top 10 list, available with Stock Advisor, and join an investing community built by individual investors for individual investors.
See the 10 stocks »
*Stock Advisor returns as of October 3, 2026.
Geoffrey Seiler has positions in Invesco QQQ Trust and Vanguard S&P 500 ETF. The Motley Fool has positions in and recommends Vanguard S&P 500 ETF. The Motley Fool has a disclosure policy.
Recommended Articles


