


The Stock Market Is Flashing a Warning Sign, but History Has Good News for Long-Term Investors
Key Points
Both the Buffett indicator and the Shiller CAPE ratio show that stocks are at historically expensive levels.
But these are valuation measures, not buy/sell signals.
Rebalance your portfolio if needed and rest assured that over the long term, stocks tend to do well.
- 10 stocks we like better than S&P 500 Index ›
Two of the market's best-known valuation indicators are sending the same clear message: Stocks are expensive right now.
The Buffett indicator, which measures the total value of U.S. stocks against U.S. gross domestic product (GDP), is nearly 240%, the highest it's ever been. Keep in mind that in a past Forbes article, Warren Buffett said famously that investors were "playing with fire" when this ratio approached 200%.
Missed Nvidia in 2009? This Rare Signal Is Flashing Again. In 2009, a "Double Down" signal flashed for a little-known chipmaker called Nvidia. For the first time in years, that same "Total Conviction" signal is flashing for a company 1/100th the size of Nvidia. Continue »
The Shiller CAPE ratio, which measures stock prices against inflation-adjusted earnings from the previous 10 years, currently clocks in at 41.5. The only time that figure has ever been higher was during the peak of the dot-com bubble.
It's clear that stock market valuations are a concern for investors. But does that mean it's time for investors to actively reduce their stock exposure? History suggests there's a better course of action.

Image source: Getty Images.
There's no denying that U.S. stocks are expensive
Studies have shown that valuations are inversely correlated with forward-looking stock market returns. In other words, more expensive stocks tend to have lower returns in future years and vice versa.
From a short-term perspective, that could be a warning that investors should plan for multiple years of lower returns than they've become accustomed to over the past several years.
But it's important to remember that the Buffett indicator and the Shiller CAPE ratio are just valuation measures. They're not buy/sell signals, and they don't indicate that a market crash is imminent. They're just saying that stocks are expensive compared to historical norms.
Think about it this way. The Buffett indicator reached around 140% during its dot-com bubble peak, and it didn't hit that level again until January 2018. But let's imagine you decided to sell at that point in 2018, arguing that stock prices were historically high and were about to crash just like last time.
Granted, you would have missed the COVID-19 recession and the 2022 bear market by doing that. But you'd also have missed a 230% total return in the S&P 500 (SNPINDEX: ^GSPC) since that point as well.
Over the long term, stocks usually do just fine
Even though stocks are pricey right now, and even if this does lead to a short-term period of low or negative returns, it's important to remember that stocks go up far more often than they go down.
Since 1932, the average bear market lasted about 1.5 years and resulted in a loss of 35%. But the average bull market lasts nearly five years and produces an average return of 177%.
If we look at the 10-year rolling total return for the S&P 500 over the past few decades, there's only been one time when it fell into negative territory.
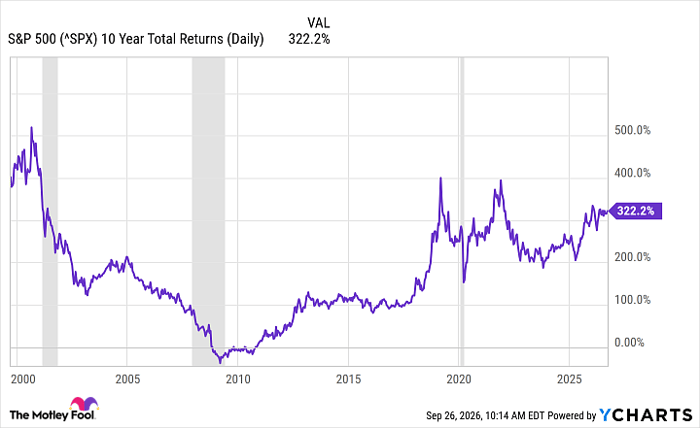
^SPX data by YCharts
That was during the "lost decade" of the 2000s, which included historic bear markets around both the dot-com bubble and the financial crisis. Most of the time, however, the rolling 10-year return was at least 100%. For the past decade, that figure has been above 200% much more often than not.
The overall point is that corrections and bear markets are normal, and you should expect to encounter them from time to time. But if you're a long-term investor and ride out those downturns, stock values usually recover and go on to establish new highs.
What I'd do right now
Current high valuation levels shouldn't be ignored. I'd expect that this could lead to several years of below-average returns for the S&P 500, given how much good news and future growth are already being priced into stocks.
But I wouldn't necessarily alter a long-term allocation to account for this. As we've seen in the past, expensive doesn't mean stocks can't get more expensive. And trying to adjust your allocation is essentially trying to time the market, which can be difficult to do effectively.
Rebalancing within the equity portion of your portfolio could make some sense. Taking some of your investment in a tech ETF and shifting it to a low-volatility ETF is a way to reduce volatility in your portfolio while maintaining your long-term allocation. But you should really only make major changes to a long-term allocation if your objective, time horizon, or risk tolerance changes.
Current stock valuations are worth watching. But you shouldn't necessarily fear them.
Should you buy stock in S&P 500 Index right now?
Before you buy stock in S&P 500 Index, consider this:
The Motley Fool Stock Advisor analyst team just identified what they believe are the 10 best stocks for investors to buy now… and S&P 500 Index wasn’t one of them. The 10 stocks that made the cut could produce monster returns in the coming years.
Consider when Netflix made this list on December 17, 2004... if you invested $1,000 at the time of our recommendation, you’d have $383,680!* Or when Nvidia made this list on April 15, 2005... if you invested $1,000 at the time of our recommendation, you’d have $1,382,954!*
Now, it’s worth noting Stock Advisor’s total average return is 937% — a market-crushing outperformance compared to 214% for the S&P 500. Don't miss the latest top 10 list, available with Stock Advisor, and join an investing community built by individual investors for individual investors.
See the 10 stocks »
*Stock Advisor returns as of September 29, 2026.
David Dierking has no position in any of the stocks mentioned. The Motley Fool has no position in any of the stocks mentioned. The Motley Fool has a disclosure policy.
Recommended Articles


