


Ford Motor vs. Tesla: What Revenue Trends Reveal About These Automotive Titans
Key Points
Over the last eight quarters, Ford Motor consistently generates higher total revenue volume than Tesla, although Tesla demonstrates a much faster rate of top-line expansion.
Both companies have displayed notably uneven quarter-over-quarter revenue patterns, featuring multiple distinct periods of sequential contraction followed by strong subsequent rebounds rather than a steady upward trajectory.
Investors analyzing these trends should watch whether the broad revenue gap separating the two companies continues to narrow over time or if the historical distance stabilizes in the upcoming reporting quarters.
- 10 stocks we like better than Ford Motor Company ›
Ford Motor: Massive Scale Amid Fluctuating Revenue Trends
Ford Motor Company (NYSE:F) primarily generates revenue by designing, manufacturing, financing, and servicing a broad spectrum of combustion and electric vehicles (EVs), including trucks, commercial vans, and sport utility vehicles for global retail consumers and large institutional fleet operators.
During the third quarter, it announced a new multi-energy vehicle manufacturing joint venture with Geely Auto located in Spain, and it separately initiated a safety recall covering certain trucks in the United States and Canada to address improperly secured fuel tank hardware components.
Tesla: Recent Quarters Highlight Revenue Growth Acceleration
Tesla (NASDAQ:TSLA) earns the vast majority of its revenue by producing and distributing electric sedans and sport utility vehicles directly to retail consumers worldwide, alongside developing comprehensive solar power generation systems and industrial energy storage solutions.
In September, it officially launched a dedicated robotaxi commercial service operating within a geofenced area in Texas, while also commencing high-volume production and direct customer deliveries of its commercial electric truck from a dedicated Nevada manufacturing facility.
Why Revenue Matters for Investors
Revenue provides an essential baseline measurement of market demand before accounting for business expenses. Closely tracking this top-line financial figure helps investors understand the total scale and growth trajectory of a business.
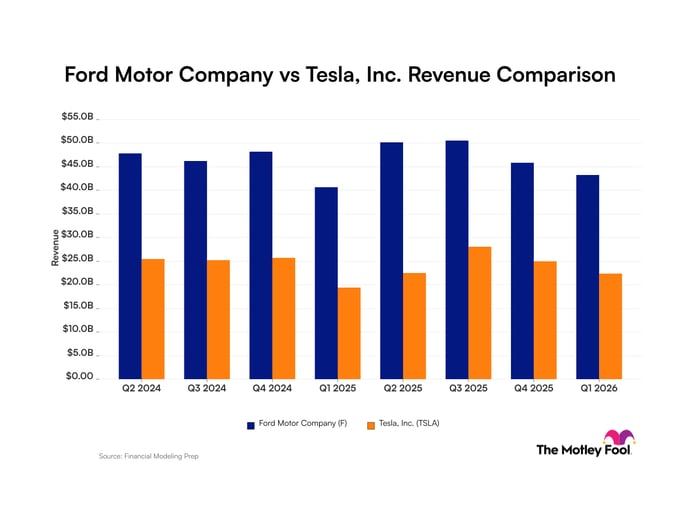
Quarterly Revenue Trends for Ford Motor and Tesla
| Calendar quarter | Ford Motor Revenue | Tesla Revenue |
|---|---|---|
| Q3 2024 | $46.2 billion (quarter ended Sept. 30, 2024) | $25.2 billion (quarter ended Sept. 30, 2024) |
| Q4 2024 | $48.2 billion (quarter ended Dec. 31, 2024) | $25.7 billion (quarter ended Dec. 31, 2024) |
| Q1 2025 | $40.7 billion (quarter ended March 31, 2025) | $19.3 billion (quarter ended March 31, 2025) |
| Q2 2025 | $50.2 billion (quarter ended June 30, 2025) | $22.5 billion (quarter ended June 30, 2025) |
| Q3 2025 | $50.5 billion (quarter ended Sept. 30, 2025) | $28.1 billion (quarter ended Sept. 30, 2025) |
| Q4 2025 | $45.9 billion (quarter ended Dec. 31, 2025) | $24.9 billion (quarter ended Dec. 31, 2025) |
| Q1 2026 | $43.3 billion (quarter ended March 31, 2026) | $22.4 billion (quarter ended March 31, 2026) |
| Q2 2026 | $48.3 billion (quarter ended June 30, 2026) | $28.2 billion (quarter ended June 30, 2026) |
Data source: Financial Modeling Prep. Data as of Sept. 25, 2026.
Foolish Take
A look at the revenue trends for Ford Motor Company and Tesla offer key insights about both businesses. Ford's revenue towers over its electric vehicle rival given it's over a century old, but I admire how Tesla's innovative approaches to the automotive industry pushed the older carmaker toward strengthening margins and capital efficiency.
In the second quarter, Ford's adjusted EBIT was up 17% year over year to $2.5 billion even though sales dropped from 2025. It's targeting $1 billion in cost reductions for 2026 as well. The venerable auto manufacturer now offers software subscription services, which grew about 50% year over year in Q2, adding a new source of revenue.
I'm doubtful Ford would have delivered these improvements if Tesla had not blazed a path that proved automotive manufacturers could do better. The company's $28.2 billion in Q2 sales is an impressive 26% year-over-year increase considering federal EV tax credits expired in September of 2025. By comparison, Ford's EV division generated only $1 billion in Q2 revenue, falling 56% year over year.
Should you buy stock in Ford Motor Company right now?
Before you buy stock in Ford Motor Company, consider this:
The Motley Fool Stock Advisor analyst team just identified what they believe are the 10 best stocks for investors to buy now… and Ford Motor Company wasn’t one of them. The 10 stocks that made the cut could produce monster returns in the coming years.
Consider when Netflix made this list on December 17, 2004... if you invested $1,000 at the time of our recommendation, you’d have $383,680!* Or when Nvidia made this list on April 15, 2005... if you invested $1,000 at the time of our recommendation, you’d have $1,382,954!*
Now, it’s worth noting Stock Advisor’s total average return is 937% — a market-crushing outperformance compared to 214% for the S&P 500. Don't miss the latest top 10 list, available with Stock Advisor, and join an investing community built by individual investors for individual investors.
See the 10 stocks »
*Stock Advisor returns as of September 27, 2026.
Robert Izquierdo has positions in Ford Motor Company and Tesla. The Motley Fool has positions in and recommends Tesla. The Motley Fool has a disclosure policy.
Recommended Articles


