


Ford Motor Company vs. General Motors: A Close Revenue Race
Key Points
Ford currently looks slightly stronger on revenue, outperforming General Motors in five of the last eight comparable quarters, though the numerical difference between the two companies remained relatively narrow throughout most of the observed time frame.
The two companies demonstrated fluctuating quarter-over-quarter revenue patterns over the last two calendar years, revealing a mixed trajectory characterized by alternating periods of expansion followed by subsequent contractions in their reported top-line figures.
Investors should monitor whether the overall revenue gap between the two companies remains tightly grouped or if one separates from the other in upcoming quarters.
- 10 stocks we like better than Ford Motor Company ›
Ford Motor: Fluctuating Quarter-to-Quarter Revenue Patterns
Ford Motor (NYSE:F) primarily generates revenue by designing, producing, and selling trucks, commercial vans, and luxury Lincoln vehicles globally, while also providing retail installment contracts, direct financing leases, wholesale dealer loans, and commercial fleet financing services to a broad base of consumers and enterprise organizations.
It established plans for a multi-energy vehicle manufacturing joint venture in Spain with Geely Auto, and it initiated a comprehensive skilled labor workforce training alliance alongside prominent corporate partners like BlackRock and Alphabet's Google.
General Motors: Maintaining Tight Competition in Quarterly Revenue
General Motors (NYSE:GM) earns most of its revenue by manufacturing a diverse lineup of trucks, commercial sport utility vehicles, and passenger cars worldwide, in addition to offering subscription-based connected vehicle services, specialized fleet vehicle sales to government agencies, and comprehensive automotive financing options for retail buyers.
While confirming strategic plans to reintegrate popular smartphone interfaces into its upcoming truck models, it issued a safety recall affecting hundreds of thousands of vehicles experiencing software issues with their rearview cameras.
Why Revenue Matters for Investors
Revenue here refers to the data provider's standardized income-statement revenue line item, providing a broad measure of total incoming money before any expenses are subtracted.
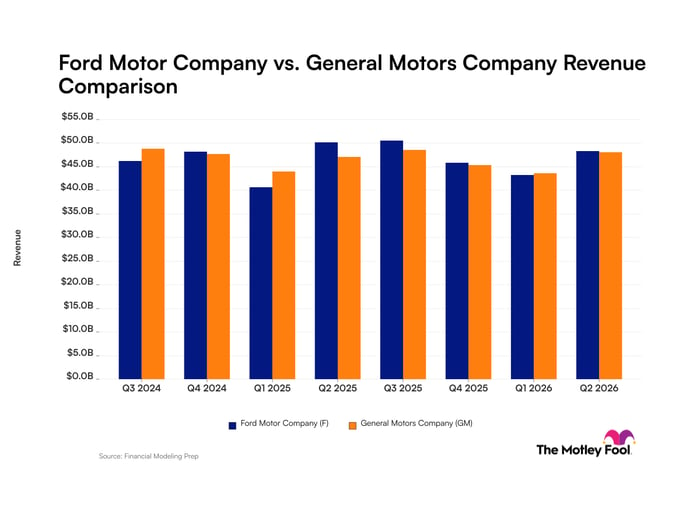
Quarterly Revenue for Ford Motor and General Motors
| Calendar quarter | Ford Motor Revenue | General Motors Revenue |
|---|---|---|
| Q3 2024 | $46.2 billion (quarter ended Sept. 30, 2024) | $48.8 billion (quarter ended Sept. 30, 2024) |
| Q4 2024 | $48.2 billion (quarter ended Dec. 31, 2024) | $47.7 billion (quarter ended Dec. 31, 2024) |
| Q1 2025 | $40.7 billion (quarter ended March 31, 2025) | $44.0 billion (quarter ended March 31, 2025) |
| Q2 2025 | $50.2 billion (quarter ended June 30, 2025) | $47.1 billion (quarter ended June 30, 2025) |
| Q3 2025 | $50.5 billion (quarter ended Sept. 30, 2025) | $48.6 billion (quarter ended Sept. 30, 2025) |
| Q4 2025 | $45.9 billion (quarter ended Dec. 31, 2025) | $45.3 billion (quarter ended Dec. 31, 2025) |
| Q1 2026 | $43.3 billion (quarter ended March 31, 2026) | $43.6 billion (quarter ended March 31, 2026) |
| Q2 2026 | $48.3 billion (quarter ended June 30, 2026) | $48.0 billion (quarter ended June 30, 2026) |
Data source: Financial Modeling Prep. Data as of Sept. 21, 2026.
Foolish Take
Watching a company's quarterly revenue trends can tell investors several things. It can be an indicator of market demand and give investors hints about future growth trajectories. It's clear from the data above that iconic Detroit rivals Ford and GM remain locked in a tight race for customer dollars.
In addition to revenue, investors should also keep an eye on gross profit margin, which indicates how much revenue the company makes after making and selling its product. The automotive industry is known for its low profit margins. Ford's gross profit margin for Q2 2026 was 7.32%, while GM's was 7.64% -- another tight race.
While both companies benefit from their size, reputation, and large contracts, they also face stiff competition and an evolving landscape. Both companies are working on new energy technologies, which could prove costly up front and eat into their margins. Investors should pay attention to this new business segment, as widespread adoption could reinvigorate these legacy automakers, but manufacturing and marketing expenses could lead them to underperform in the short term.
Should you buy stock in Ford Motor Company right now?
Before you buy stock in Ford Motor Company, consider this:
The Motley Fool Stock Advisor analyst team just identified what they believe are the 10 best stocks for investors to buy now… and Ford Motor Company wasn’t one of them. The 10 stocks that made the cut could produce monster returns in the coming years.
Consider when Netflix made this list on December 17, 2004... if you invested $1,000 at the time of our recommendation, you’d have $383,680!* Or when Nvidia made this list on April 15, 2005... if you invested $1,000 at the time of our recommendation, you’d have $1,382,954!*
Now, it’s worth noting Stock Advisor’s total average return is 937% — a market-crushing outperformance compared to 214% for the S&P 500. Don't miss the latest top 10 list, available with Stock Advisor, and join an investing community built by individual investors for individual investors.
See the 10 stocks »
*Stock Advisor returns as of September 27, 2026.
Sarah Sidlow has positions in Alphabet. The Motley Fool has positions in and recommends Alphabet and BlackRock. The Motley Fool recommends General Motors. The Motley Fool has a disclosure policy.
Recommended Articles


