


History Says a Bear Market Is Coming. Here's What the Smartest Investors Are Already Doing.
Key Points
The stock market has been reaching record highs, but so far, it's remained incredibly resilient.
It's only a matter of time, however, before a downturn begins.
The smartest move to make is perhaps also the simplest.
- 10 stocks we like better than S&P 500 Index ›
This year has been one for the record books. The S&P 500 (SNPINDEX: ^GSPC) has reached more than two dozen record highs so far in 2026, remaining resilient despite stubbornly high inflation, global economic tension, and artificial intelligence (AI) doomsday warnings.
If history shows us one thing, though, it's that no bull market can last forever. Inevitably, we'll face a pullback.
Missed Nvidia in 2009? This Rare Signal Is Flashing Again. In 2009, a "Double Down" signal flashed for a little-known chipmaker called Nvidia. For the first time in years, that same "Total Conviction" signal is flashing for a company 1/100th the size of Nvidia. Continue »
The good news is that it's simpler than you might think to not only survive a bear market but set your portfolio up to thrive. Here's what the smartest investors are already doing.
Will the stock market crash in 2026?
It's impossible to say how the market will perform in the short term, but two major market indicators suggest that stocks may be trading at a premium right now.
The S&P 500 Shiller CAPE Ratio measures the S&P 500's inflation-adjusted earnings over the past decade. The higher the ratio climbs, the more likely it is that the market is overvalued and due for a correction.
In 1929, for instance, it surpassed 30 just before the Great Depression began. Then, in 1999, it reached an all-time high of 44 as dot-com valuations surged and the market expanded into a bubble. Right now, it's at just over 40 -- which is only the second time in history it's been this high.
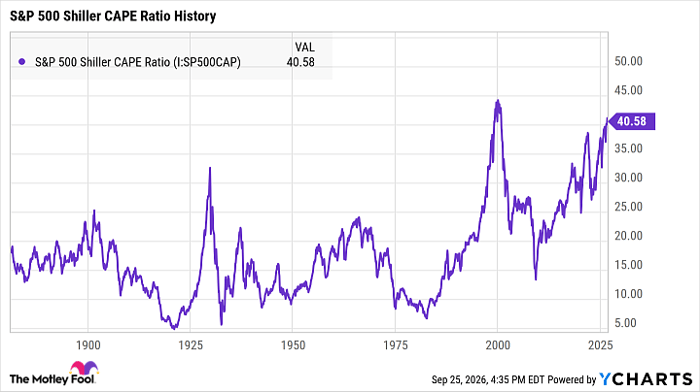
S&P 500 Shiller CAPE Ratio data by YCharts.
But the CAPE Ratio isn't the only metric sounding the alarm. The Buffett indicator -- popularized by Warren Buffett in the early 2000s as he warned about the dot-com bubble -- is also reaching record highs.
This metric measures the relationship between the total value of U.S. stocks and GDP, and a higher figure suggests the market could be overvalued. In 2001, Buffett himself noted that when it nears 200%, investors are "playing with fire." As of September 2026, it's at around 235%.
To be clear, no market indicator will be 100% accurate, and because of their backward-looking nature, these metrics can't predict future performance. That said, it's rare for the market to be as richly valued as it is right now.
The smartest investors are all making the same move
With stock prices near record highs, it can be tempting to sell your stocks or stop investing altogether before the next bear market begins. However, history shows that staying invested is far more lucrative.
Because the market's short-term performance is unpredictable, even the experts can't say what will happen. In June 2023, for example, analysts at Deutsche Bank predicted a "near 100%" chance that a recession would begin in the next 12 months. The yield curve was also inverted at the time, which is a classic recession indicator.
In other words, there was little reason to believe a bear market wasn't imminent. Yet since June 2023, the S&P 500 has surged by more than 80%. If you'd stopped investing at the first sign of trouble, you'd have missed out on lucrative returns.
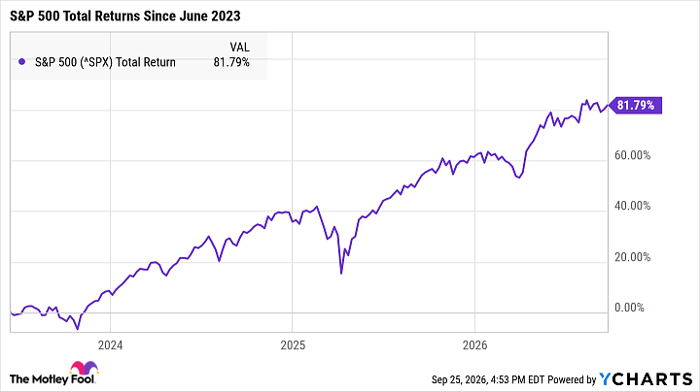
^SPX data by YCharts.
Even if a bear market or recession is around the corner, staying invested for the long term will significantly reduce your risk without having to time the market.
For instance, say you'd invested in the S&P 500 in January 2000. The dot-com bubble officially popped in March of that year, leading to a two-year bear market. It took years for the market to reach a new record high, and shortly after it did, the Great Recession began in 2007.
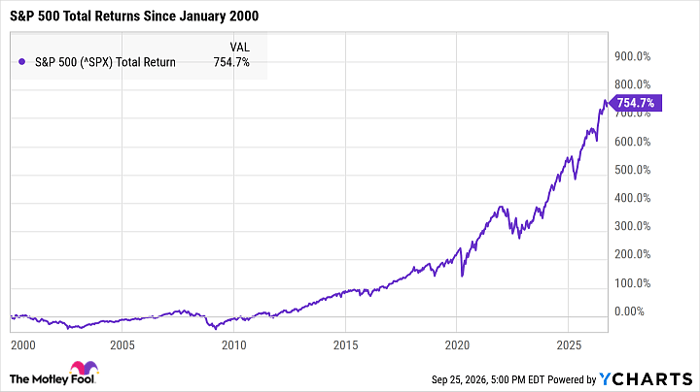
^SPX data by YCharts.
Historically speaking, investing in early 2000 would have been one of the worst possible moments to buy. Yet by today, you'd have earned total returns of more than 750%.
Nobody can say when the next bear market will begin, but it's coming eventually. The smartest thing all investors can do right now is invest in quality stocks with long-term growth potential and hold them for as long as possible.
Should you buy stock in S&P 500 Index right now?
Before you buy stock in S&P 500 Index, consider this:
The Motley Fool Stock Advisor analyst team just identified what they believe are the 10 best stocks for investors to buy now… and S&P 500 Index wasn’t one of them. The 10 stocks that made the cut could produce monster returns in the coming years.
Consider when Netflix made this list on December 17, 2004... if you invested $1,000 at the time of our recommendation, you’d have $383,680!* Or when Nvidia made this list on April 15, 2005... if you invested $1,000 at the time of our recommendation, you’d have $1,382,954!*
Now, it’s worth noting Stock Advisor’s total average return is 937% — a market-crushing outperformance compared to 214% for the S&P 500. Don't miss the latest top 10 list, available with Stock Advisor, and join an investing community built by individual investors for individual investors.
See the 10 stocks »
*Stock Advisor returns as of September 27, 2026.
Katie Brockman has no position in any of the stocks mentioned. The Motley Fool has no position in any of the stocks mentioned. The Motley Fool has a disclosure policy.
Recommended Articles


