


Is VOO or VTI the Better Long-Term Investment? Here's What History Suggests.
Key Points
The Vanguard S&P 500 ETF (VOO) and the Vanguard Total Stock Market ETF (VTI) have similar returns, volatility levels, and top holdings.
VTI includes small-cap and mid-cap stocks to VOO's large-cap coverage.
These smaller companies have traditionally produced lengthy periods of outperformance over the course of history.
- 10 stocks we like better than Vanguard Morningstar Total Stock Market ETF ›
For investors looking to build the core of their investment portfolios, there are two ETFs I'd consider first: the Vanguard S&P 500 ETF (NYSEMKT: VOO) and the Vanguard Total Stock Market ETF (NYSEMKT: VTI).
At a structural level, they look very similar. They're tremendously diversified, led by America's largest companies, and charge identical 0.03% expense ratios. Their performance histories are very similar, as are their volatility levels.
Missed Nvidia in 2009? This Rare Signal Is Flashing Again. In 2009, a "Double Down" signal flashed for a little-known chipmaker called Nvidia. For the first time in years, that same "Total Conviction" signal is flashing for a company 1/100th the size of Nvidia. Continue »
It would be easy to assume that the two funds are largely interchangeable, given their similarities. But that ignores one important point. Their compositions aren't similar at all.
The Vanguard S&P 500 ETF invests in 500 of the largest companies in the United States. But the Vanguard Total Stock Market ETF targets the entire investable U.S. equity universe, more than 3,500 different stocks in all. Because they're both market cap-weighted, they skew heavily toward large caps and there's about an 88% overlap of assets between them.
But when choosing between these two ETFs, the question really comes down to "should you include small-cap and mid-cap stocks in your portfolio or not?" The answer will go a long way in determining which one is the better fit for you.

Image source: Getty Images.
Why small-caps deserve to be in your portfolio
You wouldn't guess it by looking at U.S. equity returns over the past several years, but small-caps actually outperform large caps every once in a while.
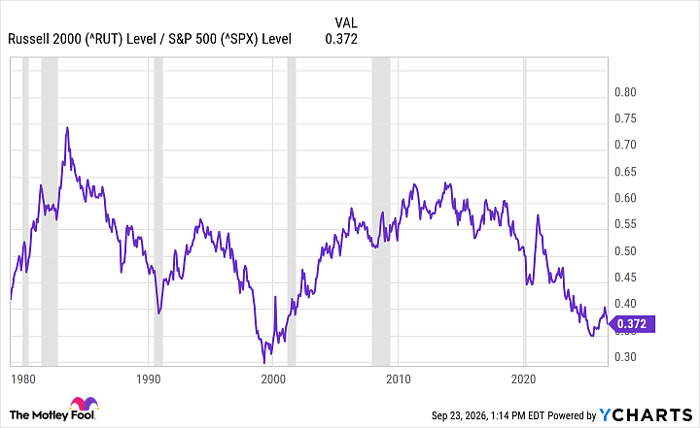
It's actually happening right now in 2026. The iShares Russell 2000 ETF (NYSEMKT: IWM) is beating the Vanguard S&P 500 ETF by about 2% year to date. But lengthier stretches of outperformance have occurred multiple times over the past several decades.
Fundamental Chart data by YCharts
Small caps outperformed large caps during almost the entirety of the 2000s and into the start of the 2010s. 1991-1994 was also a good period for smaller companies, as was the first half of the 1980s.
Adding small-caps to a large-cap portfolio not only enhances returns over multiyear periods but also reduces portfolio volatility through diversification.
When you own the S&P 500 (SNPINDEX: ^GSPC), you're mostly getting companies that have graduated from the emerging stage and are now well-established businesses. You're largely missing out on the higher-growth period when companies really break out. By owning the entire U.S. equity market, you're adding those faster-growing small companies to your portfolio. Not every company will eventually grow into a large cap, but several will. Investing in the Vanguard Total Stock Market ETF allows you to invest in these much earlier in their life cycles.
Here's which ETF I'd choose
For a long-term core portfolio holding, I'd give the Vanguard Total Stock Market ETF the slight edge.
Choosing the Vanguard S&P 500 ETF is certainly defensible. There's nothing wrong with building your portfolio around hundreds of well-established and successful companies. But from a portfolio construction standpoint, I prefer to own everything -- the good and the bad, the mature and the developing, the growth and the value.
But adding small-caps does change the calculus a bit. Here are a few things to consider:
- Because they're more reliant on debt to fund growth, smaller companies tend to be more sensitive to changes in interest rates. In a vacuum, that could be a short-term negative for small-caps.
- Earnings growth rates can fluctuate more frequently. Part of the reason for recent small-cap underperformance has been stagnant or even declining earnings in some sectors. On the flip side, earnings growth has been accelerating over the past year and is helping to fuel the group's rebound.
- Small-caps tend to be more volatile than large caps. That extra risk won't translate into higher returns all the time, which is why it's better suited for long-term buy-and-hold.
Some of the current small-caps will inevitably fail. Around 40% of current Russell 2000 components have negative trailing-12-month earnings. But others could become future market leaders. The Vanguard Total Stock Market ETF allows me to participate in both today's winners and potentially the next generation of leaders.
In my opinion, the Vanguard Total Stock Market ETF is the better choice.
Should you buy stock in Vanguard Morningstar Total Stock Market ETF right now?
Before you buy stock in Vanguard Morningstar Total Stock Market ETF, consider this:
The Motley Fool Stock Advisor analyst team just identified what they believe are the 10 best stocks for investors to buy now… and Vanguard Morningstar Total Stock Market ETF wasn’t one of them. The 10 stocks that made the cut could produce monster returns in the coming years.
Consider when Netflix made this list on December 17, 2004... if you invested $1,000 at the time of our recommendation, you’d have $384,839!* Or when Nvidia made this list on April 15, 2005... if you invested $1,000 at the time of our recommendation, you’d have $1,385,657!*
Now, it’s worth noting Stock Advisor’s total average return is 936% — a market-crushing outperformance compared to 213% for the S&P 500. Don't miss the latest top 10 list, available with Stock Advisor, and join an investing community built by individual investors for individual investors.
See the 10 stocks »
*Stock Advisor returns as of September 24, 2026.
David Dierking has positions in Vanguard Morningstar Total Stock Market ETF. The Motley Fool has positions in and recommends Vanguard S&P 500 ETF. The Motley Fool has a disclosure policy.
Recommended Articles


