


This Stock Market Warning Is Flashing Red for the 2nd Time in 145 Years. Here's What History Says Comes Next.
Key Points
A CAPE above 40 suggests the S&P 500 is historically expensive, but it does not predict when stocks will fall.
CAPE has been more useful for setting long-term return expectations than for timing a crash.
Investors should keep investing selectively, focusing on durable, profitable companies with strong balance sheets.
- 10 stocks we like better than S&P 500 Index ›
This has been anything but a boring year for the stock market. After falling sharply earlier in the year, at recent prices, the Dow Jones Industrial Average is up 15% from its March low, while the S&P 500 (SNPINDEX: ^GSPC) is up 22%, and the tech-heavy Nasdaq Composite is up a whopping 30%.
But as exciting as the rally has been, there's a figure that should make you pause: the Shiller CAPE ratio. The important valuation metric has recently reached more than 40 -- a level only seen once before in modern stock market history.
Missed Nvidia in 2009? This Rare Signal Is Flashing Again. In 2009, a "Double Down" signal flashed for a little-known chipmaker called Nvidia. For the first time in years, that same "Total Conviction" signal is flashing for a company 1/100th the size of Nvidia. Continue »
Here's what that means for investors.
The stock market has rarely been this expensive
The CAPE, or cyclically adjusted price-to-earnings ratio, compares the price of the S&P 500 with the earnings of all the companies that make up the index -- except that, unlike a normal price-to-earnings ratio (P/E), the earnings are averaged over the past 10 years and adjusted for inflation.
Smoothing the earnings out over a decade helps reduce the noise of individual good and bad years and gives a much fairer picture of how pricey the stock market is. That's why it's one of the most watched on Wall Street.
The CAPE's historical average is about 17. Today, it's hovering above 40. The only other time the CAPE has reached this high was during the dot-com era in 1999 and 2000.
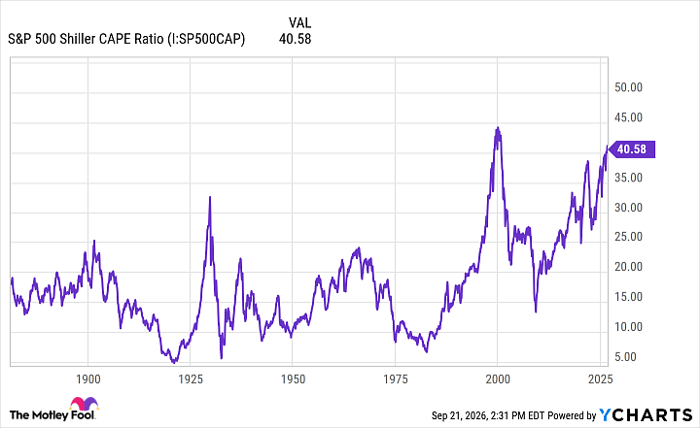
S&P 500 Shiller CAPE Ratio data by YCharts
A CAPE above 40 is a warning, not a countdown
Now, this is concerning, no doubt. A CAPE above 40 is hardly the only parallel you can draw to the stock market of the 1990s -- a potentially transformative technology fueling a huge wave of investment, capturing the imagination of investors, and sending stocks racing higher.
But that doesn't mean we are necessarily near a dot-com-style crash. Just as there are parallels between today and the stock market of the '90s, there are plenty of differences.
And beyond this, one data point is not enough to establish a reliable historical pattern. Instead, what the historical record can tell us is that when the CAPE is higher than 30, returns over the next decade, on average, tend to disappoint. That's according to research done by Robert Shiller himself, the Yale economist who created the metric.
The CAPE is much better at setting long-term expectations than predicting when the market will turn. Stocks could fall tomorrow, but they could also continue climbing before a major correction eventually arrives.
Even terrible timing can work out over the long run if you stay invested
Consider what happened to an investor who bought at the peak of the dot-com bubble. From March 24, 2000, through Sept. 10, 2026, the S&P 500's price level increased 397%, even before accounting for dividends.
In other words, $1,000 invested at one of the worst possible moments would have grown to nearly $5,000 before accounting for dividends -- and that's without adding another dime. Of course, it wasn't a smooth ride, and it took years for the investment to recover, but those who remained patient were eventually rewarded.
What long-term investors should do now
So where does that leave us?
Selling everything based on a CAPE above 40 is not the way to go. Investors who saw the CAPE creep up to uncomfortable levels during the 1990s and decided to sell would have lost out on years of incredible returns.
Instead, investors should take the opportunity to examine what they own. Does the company have a durable competitive advantage? Is it consistently profitable, or is the path to operating in the black clear? Does it have the balance sheet and cash flows to survive if a crash does come?

Image source: Getty Images.
And critically, with the CAPE at 40 implying high expectations from investors, is the valuation based in reality or hype? Does it require everything to go right?
Investors should be even more selective about what they choose to invest in, but they shouldn't be afraid to continue investing. History's most important lesson is that over the long haul, patient, steady investing has always been the winning formula.
Should you buy stock in S&P 500 Index right now?
Before you buy stock in S&P 500 Index, consider this:
The Motley Fool Stock Advisor analyst team just identified what they believe are the 10 best stocks for investors to buy now… and S&P 500 Index wasn’t one of them. The 10 stocks that made the cut could produce monster returns in the coming years.
Consider when Netflix made this list on December 17, 2004... if you invested $1,000 at the time of our recommendation, you’d have $395,625!* Or when Nvidia made this list on April 15, 2005... if you invested $1,000 at the time of our recommendation, you’d have $1,397,147!*
Now, it’s worth noting Stock Advisor’s total average return is 951% — a market-crushing outperformance compared to 214% for the S&P 500. Don't miss the latest top 10 list, available with Stock Advisor, and join an investing community built by individual investors for individual investors.
See the 10 stocks »
*Stock Advisor returns as of September 23, 2026.
Johnny Rice has no position in any of the stocks mentioned. The Motley Fool has no position in any of the stocks mentioned. The Motley Fool has a disclosure policy.
Recommended Articles


