


Costco Stock Holds $888 as Q4 Earnings Put Membership Growth and Margins in Focus
TradingKey - Costco completed its close at $893.9, which matches the provided chart reference of $893.93. The stock currently trades under the $895.77 Fibonacci pivot, and under the 920.56-924.61 resistance zone. With the September earnings release date approaching (9/24), the near-term trend remains bearish. Wall Street analysts generally agree Costco’s sales will be positive for the fourth quarter, but the true test of the company’s value will be margins, and if the company’s membership renewals will justify the valuation.
Q4 Sales Already Show Strong Top-Line Momentum
Costco reports its monthly sales figures throughout the quarter. From the figures released, Costco reported a strong finish to the quarter. For the fourth quarter of 2026, which ends August 30, total net sales increased by about 11.3% to $93.9 billion. Comparable sales increased by about 9.4%. Excluding the effects of foreign exchange rates and the price of oil, comparable sales increased by about 6.7%.
U.S. comp sales for Q4 increased 10.7% with adjusted U.S. comp sales growth of 7.2%.
Comp sales made possible by digital channels grew approximately 19.5% in Q4.
Comp sales growth of this magnitude raises expectations for future results. For Costco, the question will be how well the Company converted the increased customer traffic and digital sales growth into higher sales.
Membership Income Is the Most Important Earnings Driver
Costco's membership model is the foundation of the investment case.
During the third quarter, membership fees increased 10.7% to $1.37 billion. The total paid membership number was 82.9 million, with 41.2 million of those memberships being the more profitable Executive level memberships. Renewal rates for all memberships were 89.7%, with renewal rates in the U.S. and Canada improving to 92.2%.
I would focus on these figures when they are released.
Margins on membership fees are high and allow Costco to be price competitive on the merchandise it sells. Continued improvements in renewal rates and membership levels would be positive.
Digital Growth Is Becoming a Second Traffic Engine
Digital growth has become virtually unmanageable for Costco, requiring coverage outside of traditional limits.
As of recently, Costco's digitally enabled comparable sales grew 21.5% in Q3 and 19.5% in Q4. In the last quarter, Costco’s digital sales channel recorded a comparable sales growth of approximately 21.5%. Costco has historically built a moat through its membership model, with its economy being based on physical warehouse traffic. The recent growth has shown Costco can expands its digital and physical sales channels while maintaining its membership model.
Rather than focusing on one sales channel at a time, Costco can target its membership base to capture a greater share of members’ wallets. Further, a base membership can be targeted to shop both physically and digitally, all without compromising Costco’s warehouse economics.
Margins Are the Main Fundamental Risk
Gross margins can be volatile for Costco; however, in Q3 of 2026, Costco reported a gross margin of 11.04%, down 21 basis points from Q3 2025. Excluding the effects of changes in gasoline prices, Costco’s gross margins were up 1 basis point. Pressures on Costco to absorb price increases in an effort to maintain consumer loyalty, created an increasingly competitive environment. That said, having margin pressure on a short-term basis can ultimately be beneficial in the long run.
September's cost environment has become more challenging due to increasing fuel, transport and food costs.
While these will impact costs across fiscal 2027, especially if inflationary pressure on freight and labor persists, near-term concerns may be more about product inflation and gross margin.
Generally speaking, analysts have a favorable view of the company and have set a realistic target for Costco.
Consensus Sets a High but Achievable Bar
Current expectations are a roughly 10.1% YoY increase in revenue to $94.9 billion and EPS of $6.55.
In Q4 FY2025, the company reported Revenues of $86.16 billion and EPS of $5.87.
While the revenue estimate looks attainable given Costco disclosed reported net sales of $93.9 billion for the quarter, EPS is uncertain.
High membership renewals allay EPS concerns to some extent. It would be more concerning if membership renewals and margins deteriorated at the same time.
Special Dividend Remains Optional Upside
Costco had $18.95 billion in cash at the end of quarter 3, in addition to about $1.05 billion in short term investments.
Many are predicting another special dividend.
The last special dividend was $15 per share, and was paid in early 2024.
Although no announcement has been made about a special dividend, cash is cash, and management can always opt to give cash back to shareholders.
Valuation Leaves Little Room for Weak Execution
One of the reasons Costco’s share price is about $894 is because of costumers’ renewing memberships, consistent store traffic, and effective expansion to other countries.
As long as Costco keeps executing at this level, shareholders should be happy.
Considering that inflation pressures remain elevated in 2026, Costco has showed strong renewal rates on core memberships, which helps the company maintain a price premium.
There are plenty of reasons for Costco’s premium valuation, and there’s always a chance for shareholders to see lower returns and weak performance as a consequence of inflation.
Costco Technical Analysis: $888.11 Is the Immediate Support Test
Costco's (COST) latest closing price was around $893.9 as it continued its decline after facing resistance at the 920.56-924.61 levels. One thing that caught my eye was the developing bearish structure with the downside target in the 874.81-879.81 area. Additionally, the price is below the moving average at $924.61.
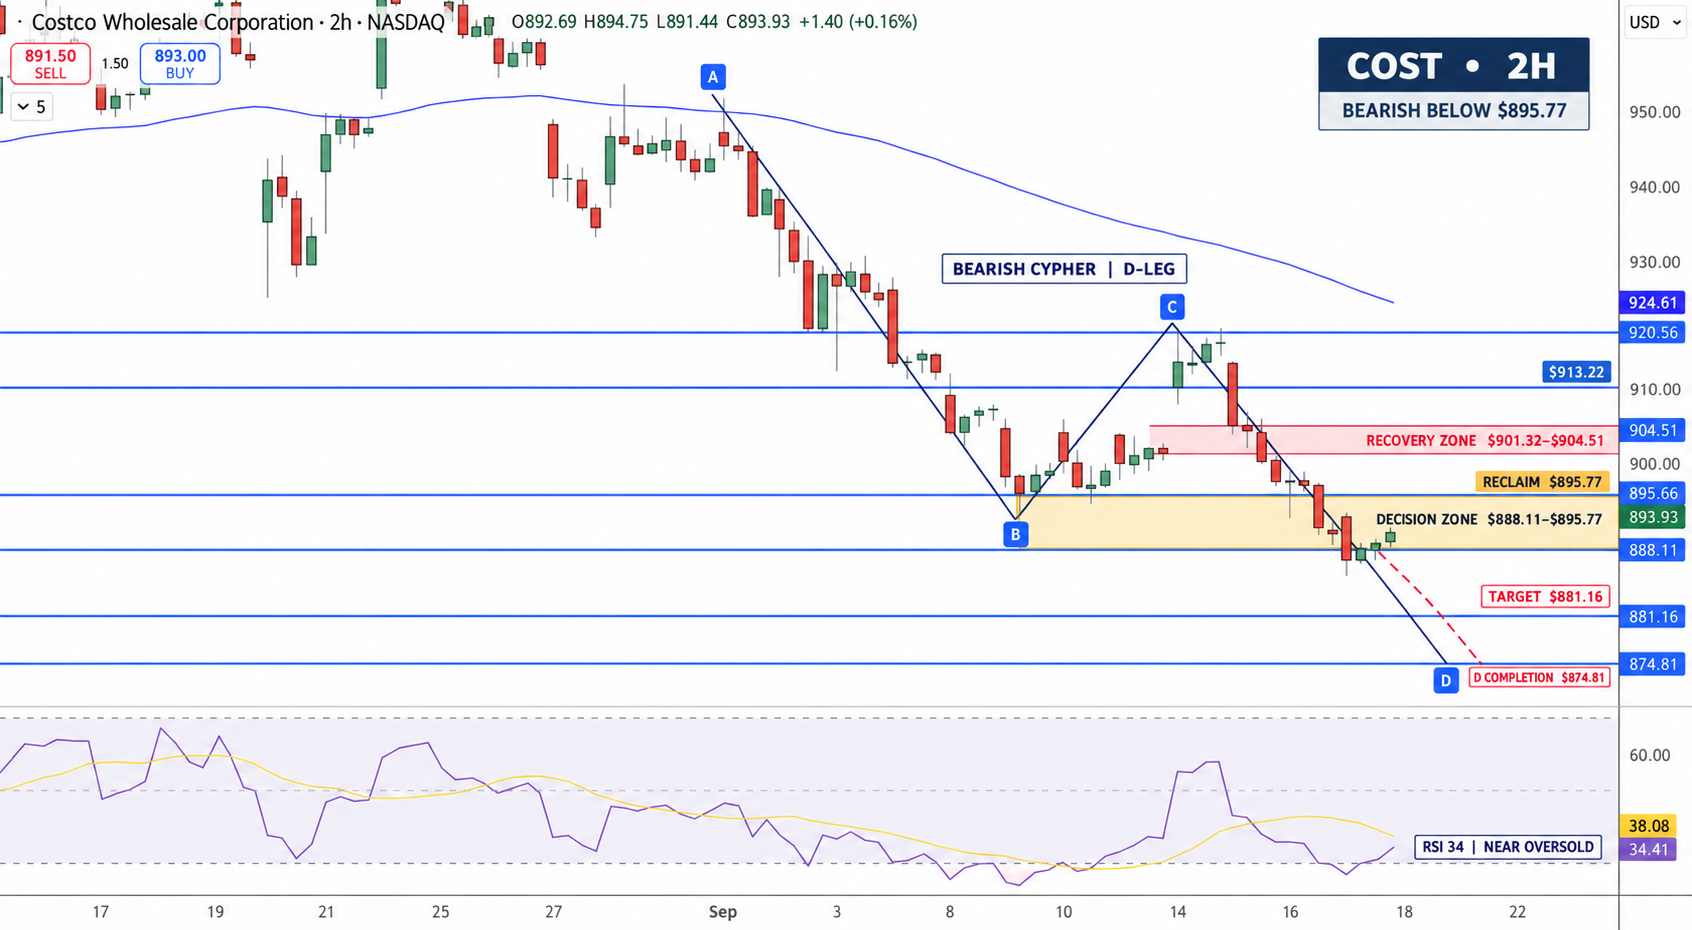
Costco Price Chart - Source: Tradingview
The near-term downside target is around $888.11 and a potential bounce could happen if $888.11 holds. However, from a bearish view, a close above $904.51 would negate the bearish setup.
Additional levels of resistance are around $901.32 and $904.51. Resistance above $908.18 would be at $913.22.
RSI is at 34 and is below its signal line (38). With that, a bounce may happen in the near-term, however, the bearish setup remains intact.
If price breaks below $888.11, the next support is around $881.16. Further downside would see price head toward the bearish target in the 874.81-879.81 area.
Why is Costco stock in focus now?
Some of the levels of interest for Costco ahead of the company's earnings on September 24 are international and domestic membership renewal rates, membership fee income, average net margins on sales, and cost-cutting initiatives.
What level confirms a stronger COST recovery?
Selling pressure will likely lessen once we reclaim $895.77. A retrace above $904.51 would negate the bearish setup and bring $908.18 and $913.22 into play. A fall below $888.11 would become excursive and bring $881.16 and $874.81 into play.
Bottom Line
Although there are plenty of positives to discuss around Costco going into Q4, the technical outlook around the $890 level is less than ideal. Costco’s membership model remains strong, and they will likely benefit from the rising inflation as consumers rethink their value-based shopping. I still see risks to the downside and will continue to look to sell rallies until we break $904.51. I see support at $888.11, and a break below that brings $881.16 into play. A break above $904.51 negates the bearish outlook and brings $913.22 into play.
Recommended Articles


