


Applied Materials vs. Marvell Technology: Which Tech Stock Is a Better Buy in 2026?
Key Points
Applied Materials is a market leader in providing the engineering equipment and services essential for advanced semiconductor manufacturing.
Marvell Technology is experiencing rapid growth by providing high-speed networking and custom silicon solutions for the artificial intelligence infrastructure market.
Which semiconductor stock deserves a spot in your portfolio?
- 10 stocks we like better than Applied Materials ›
As the building blocks of modern computing evolve, investors often weigh the giants of manufacturing against the specialists in connectivity. Should you bet on the equipment that makes chips, or the silicon that powers data centers?
Applied Materials (NASDAQ:AMAT) provides the essential tools required to fabricate complex microchips, while Marvell Technology (NASDAQ:MRVL) designs high-speed networking and custom silicon for the cloud. Both companies are critical to the hardware ecosystem, but they offer distinct exposure to the chip market. This comparison explores which stock better aligns with your goals for 2026.
The case for Applied Materials
Applied Materials sells specialized tools and factory automation software to the world's largest chipmakers. The company remains a titan among semiconductor stocks by providing the equipment required to produce advanced microchips. Customer concentration like this adds a layer of risk, as two clients accounted for nearly 19% and 15% of revenue in its latest annual report.
In the fiscal year ended Oct. 26, 2025, revenue reached approximately $28.4 billion, an increase of nearly 4.4% compared with the prior year. Net income was close to $7 billion, yielding a net margin of 24.7%. This steady growth followed several years of rising demand for materials engineering in the chip sector.
As of its October 2025 balance sheet, the debt-to-equity ratio is roughly 0.3, representing total debt divided by shareholder equity. The current ratio, which measures current assets against liabilities, is approximately 2.6. Free cash flow, which is calculated as cash flow from operations minus capital expenditures, was nearly $5.7 billion.
The case for Marvell Technology
Marvell Technology designs and sells data infrastructure semiconductor solutions, focusing on networking and storage. It serves major cloud providers and maintains a long-term partnership with Alphabet (NASDAQ:GOOGL) (NASDAQ:GOOG) for custom silicon solutions. Customer concentration is high, as its 10 largest clients accounted for nearly 82% of total revenue in its latest annual report.
In the fiscal year ended Jan. 31, 2026, revenue reached approximately $8.2 billion, representing year over year growth of roughly 42.1%. This performance led to net income of nearly $2.7 billion and a net margin of 32.6%. The surge in demand for AI-optimized data center hardware significantly boosted results compared with the prior fiscal year.
According to Marvell’s January 2026 balance sheet, its debt-to-equity ratio is approximately 0.3, while its current ratio is close to 2.0. Free cash flow reached roughly $1.4 billion. Note that stock-based compensation represented roughly 33.8% of operating cash flow, which inflates reported cash generation since SBC is a non-cash expense added back in the cash flow statement.
Risk profile comparison
Applied Materials is vulnerable to U.S. export controls, particularly those limiting sales to China. These restrictions can force the loss of market share to rivals like KLA (NASDAQ:KLAC). Earlier this year, the company settled for nearly $252 million with the U.S. Department of Commerce due to previous export violations. Furthermore, the industry remains subject to historical cyclicality.
Marvell faces risks tied to the sustainability of AI infrastructure spending. If cloud providers reduce capital expenditures or successfully design more of their own chips, the company could lose market share. Competition from giants like Broadcom (NASDAQ:AVGO) and Nvidia (NASDAQ:NVDA) remains intense, and reliance on manufacturing partners in Taiwan exposes the business to regional trade tensions.
Valuation comparison
Applied Materials appears more conservatively priced based on its forward P/E and P/S ratio, while Marvell Technology carries a higher premium for its growth.
| Metric | Applied Materials | Marvell Technology |
|---|---|---|
| Forward P/E | 35.4 | 55.9 |
| P/S ratio | 12.7 | 25.1 |
Valuation metrics sourced from Financial Modeling Prep (FMP) and may differ from other data providers.
Which stock would I buy in 2026?
Comparing the stock charts for Marvell and Applied Materials over the most recent five- and 10-year periods, an obvious trend emerges: Up until very recently, they've been trading pretty closely, reflecting the cyclicality of the industry they're in.
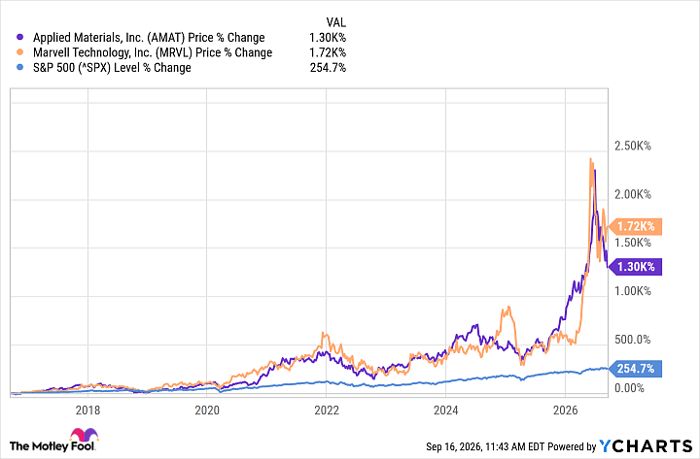
AMAT data by YCharts
Marvell, in and of itself, is not a terribly attractive investment to me purely because of how much exposure it has to the artificial intelligence boom. For one thing, it faces fierce competition from multitrillion-dollar chip giants like Nvidia and Broadcom. Additionally, the big tech titans have been pouring resources into AI investments, but thus far haven't had a lot to show for it, leading some to speculate they may start pulling back. Any slowdown in that spending (even if it's somewhat circular) would hit Marvell hard.
Applied Materials isn't posting bonkers-level growth, but it's also not as expensive as Marvell, and I think the company is a less-risky bet if you're seeking exposure to the semiconductor industry.
Should you buy stock in Applied Materials right now?
Before you buy stock in Applied Materials, consider this:
The Motley Fool Stock Advisor analyst team just identified what they believe are the 10 best stocks for investors to buy now… and Applied Materials wasn’t one of them. The 10 stocks that made the cut could produce monster returns in the coming years.
Consider when Netflix made this list on December 17, 2004... if you invested $1,000 at the time of our recommendation, you’d have $420,109!* Or when Nvidia made this list on April 15, 2005... if you invested $1,000 at the time of our recommendation, you’d have $1,303,689!*
Now, it’s worth noting Stock Advisor’s total average return is 938% — a market-crushing outperformance compared to 211% for the S&P 500. Don't miss the latest top 10 list, available with Stock Advisor, and join an investing community built by individual investors for individual investors.
See the 10 stocks »
*Stock Advisor returns as of September 17, 2026.
Erin Kennedy has no position in any of the stocks mentioned. The Motley Fool has positions in and recommends Alphabet, Applied Materials, Broadcom, KLA, Marvell Technology, and Nvidia. The Motley Fool has a disclosure policy.
Recommended Articles


