


Broadcom Stock Price Forecast: Can It Break $500 Before Earnings Amid Strong Custom AI Chip Demand?
TradingKey - On August 12 ET, Broadcom (AVGO) closed at $416.05, remaining about 16% below its 52-week high of $495.
Since hitting a recent low of $374.61 on July 30, Broadcom has rebounded about 11% over the past 10 trading days, touching $432.73 intraday, significantly outperforming the sector as the Philadelphia Semiconductor Index gained about 3% over the same period.
As the fiscal third-quarter earnings release on September 2 approaches, the core question for the market is whether strong demand for custom AI chips (ASICs) can drive the stock price past the $500 mark.
Why Broadcom Stock Is Rising
This rally was mainly driven by Broadcom's better-than-expected deliveries in the custom AI chip (ASIC) field. In the second quarter of fiscal year 2026, Broadcom achieved revenue of $22.187 billion, up 48% year-over-year. Among this, revenue from the AI semiconductor business reached $10.8 billion, surging 143% year-over-year and accounting for nearly half of total revenue. Custom AI chips have achieved large-scale commercialization.
Broadcom's management revealed during the earnings call that new AI semiconductor orders added during the quarter exceeded $30 billion, compared with $10.8 billion in recognized revenue over the same period. The order backlog provides high visibility for revenue conversion over the coming quarters.
In terms of customer structure, Broadcom has secured six hyperscale cloud providers, including Google (GOOGL), Meta Platforms (META), Anthropic, and OpenAI. In July 2026, Broadcom reached a partnership extension agreement with Apple (AAPL) to extend its partnership for supplying multiple generations of custom high-performance chips through 2031. Although this agreement primarily involves general-purpose custom chips, it also validates Broadcom's competitive strength in high-end custom chip design, providing indirect support for its AI ASIC business.
Can Broadcom Stock Continue to Rise?
The core factors supporting the stock price center on order visibility and valuation. Broadcom reaffirmed its FY2026 AI semiconductor revenue target of approximately $56 billion and its FY2027 target of over $100 billion. Regarding valuation, based on consensus estimates from multiple institutions, the current stock price of $416 corresponds to a forward P/E ratio of approximately 36x.
Regarding institutional ratings, Morgan Stanley reaffirmed its "Overweight" rating on Broadcom in a research report released in July 2026 and maintained a price target of $502, ranking Broadcom as a core AI beneficiary second only to Nvidia and considering market concerns over MediaTek significantly eroding Google's TPU share to be exaggerated.
As of August 12, based on Wall Street's average price target of approximately $527.88, there remains an upside of about 26.88% compared with the current level of $416.05.
Overall, Broadcom's stock price is supported by fundamentals in the medium to long term. An order backlog of over $30 billion, an FY2027 AI semiconductor target of over $100 billion, coupled with Wall Street's average price target of $527.88, indicate clear upside potential.
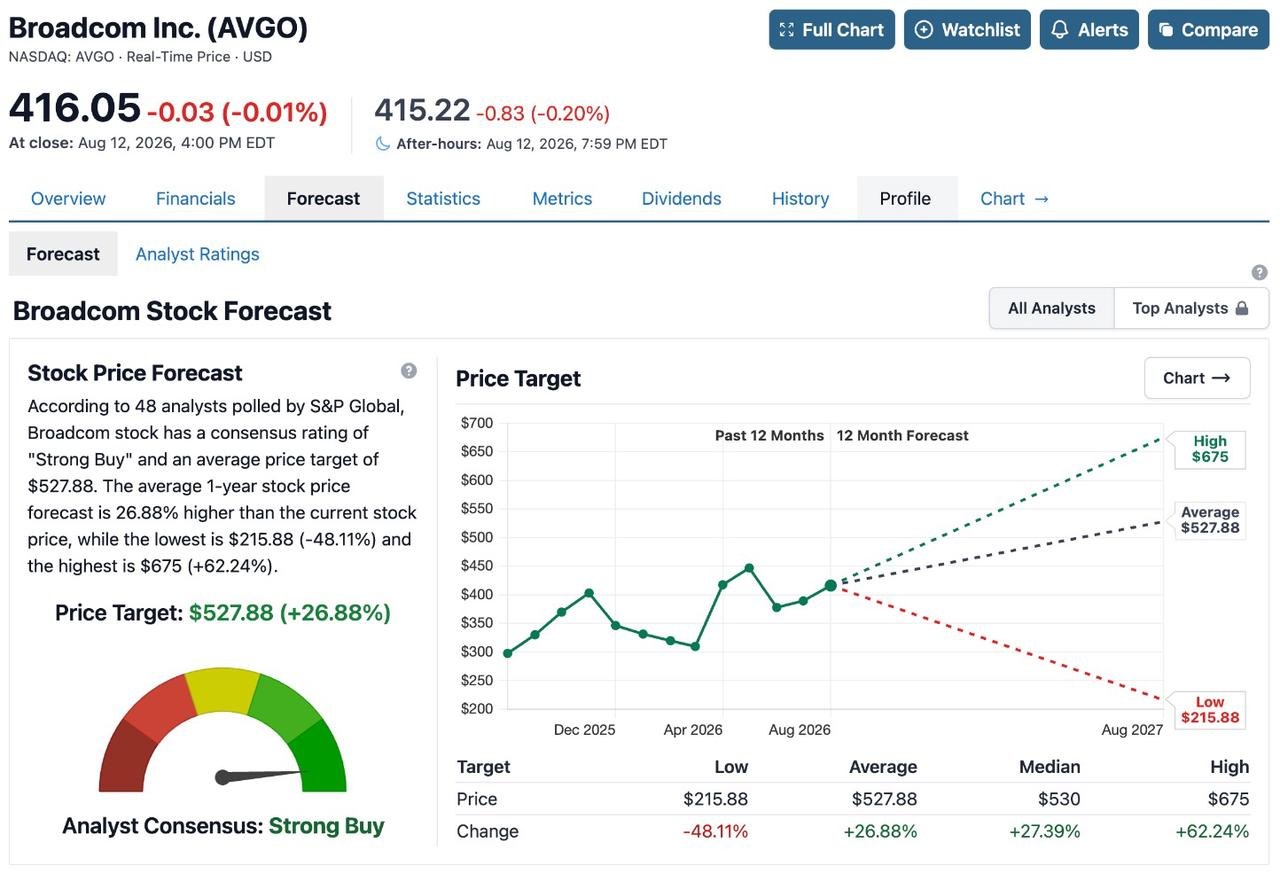
[Source: Stock Analysis official website]
Broadcom Stock Price Prediction: Can It Break $500 Ahead of Earnings?
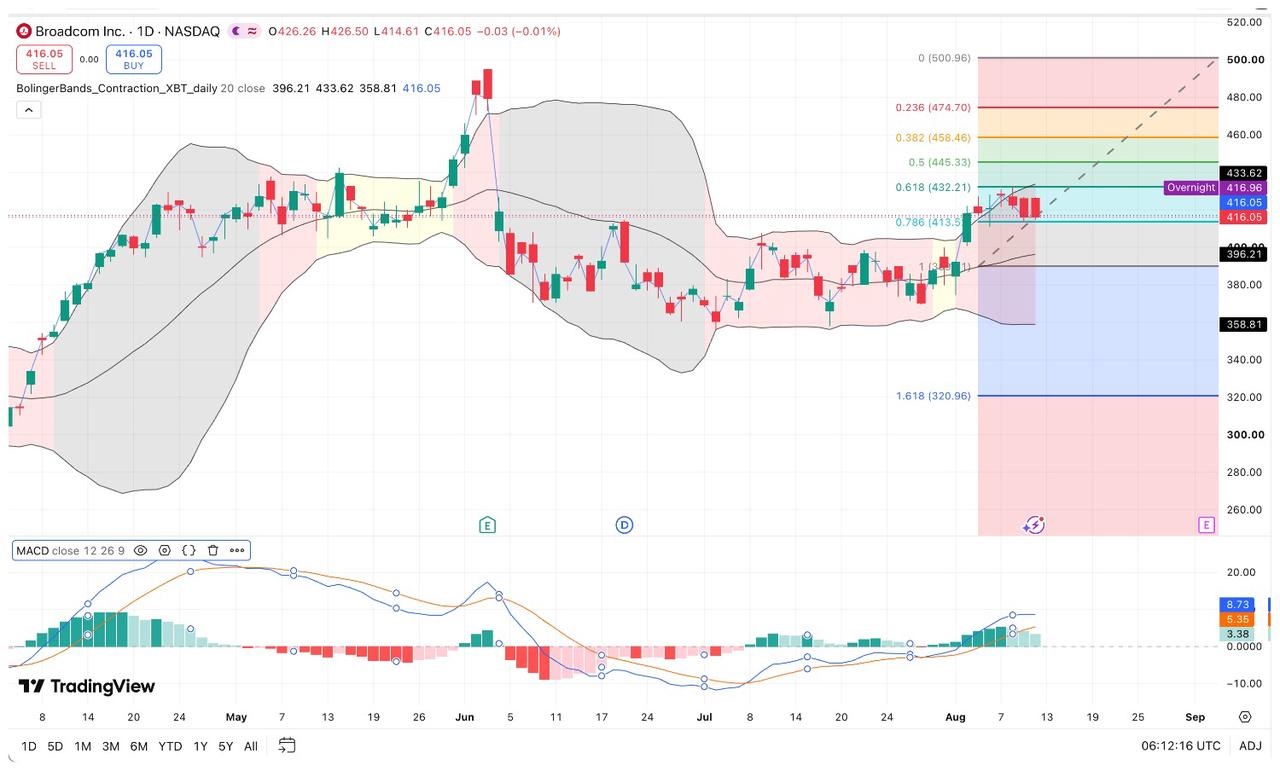
[Source: TradingView]
On the technical front, Broadcom closed at $416.05 on August 12, rebounding about 11% from its low of $374.61 on August 3. Over the past six trading days, the stock price reached as high as $432.73, approaching its 52-week high of $495, but subsequently pulled back under profit-taking pressure.
The current stock price sits above most major moving averages, but the short-term moving average system shows a crossover signal: the 5-day moving average has crossed below the 20-day moving average, indicating short-term pullback pressure. The MACD remains positive, but the histogram is gradually narrowing, suggesting that upward momentum is weakening.
Regarding key price levels, the first resistance above is around $432.21, largely coinciding with the upper Bollinger Band at $433.62; once broken, the next target is the previous high of $495. As of August 12, the 5-day and 10-day moving averages converge in the $406 to $409 range, forming the first support zone, with stronger support around the $396 and $359 levels.
Overall, the likelihood of Broadcom's stock price breaking above $500 before its earnings report on September 2 is low: technically, resistance is dense around $432, and the narrowing MACD histogram indicates insufficient short-term upward momentum.
In addition to technical resistance, historical patterns also exert pressure, as the stock fell over 11% after earnings reports in December 2025 and June 2026. Even if results beat expectations, the stock price could still come under pressure if guidance fails to meet the most optimistic projections. The market expects Q3 EPS of $3.21, a year-on-year increase of about 90%, and the difficulty of achieving this high-growth target itself poses earnings pressure.
The likelihood of gradually reaching $500 after the earnings report is higher than a direct breakthrough before earnings. If the September 2 earnings report confirms that the revenue path for AI semiconductors is not materially hindered by the supply side or competitive landscape, and Q4 guidance remains optimistic, the stock price is expected to mount a challenge toward its historical high of $495.
Recommended Articles


