


Crypto Today: Bitcoin, Ethereum, and Ripple risk steeper correction as bearish pressure mounts
- Bitcoin remains under pressure, with losses extending below $63,000 as bearish momentum resurfaces.
- Ethereum edges lower to a crucial support cluster, risking a drop below the 50-day EMA at $1,865.
- Ripple hovers above the crucial psychological support of $1.00 amid persistent downside pressure.
Bitcoin (BTC) trades below $63,000 on Friday, projecting a downside bias as selling pressure resurfaces. Ethereum (ETH) and Ripple (XRP) also take a bearish path, risking a drop below the 50-day Exponential Moving Average (EMA) at $1,856 and the $1.00 psychological support, respectively. The technical outlook for BTC, ETH, and XRP is bearish, with downside momentum building.
Technical outlook: Will Bitcoin's price drop to $60,000?
Bitcoin maintains a bearish near-term bias as the price drops below $63,000, capped below the 50-day Exponential Moving Average (EMA) at $64,453 and the 200-day EMA at $73,089. The King Crypto is also trading below the broken upward support trendline around $63,982, suggesting an increase in downside pressure.
Momentum is soft, with the Relative Strength Index (RSI) at 42 and the Moving Average Convergence Divergence (MACD) declining into the negative territory, hinting that downside pressure persists.
The immediate support for BTC lies at the July 6 low of $61,307, guarding the downside to the July 1 low at $57,800.
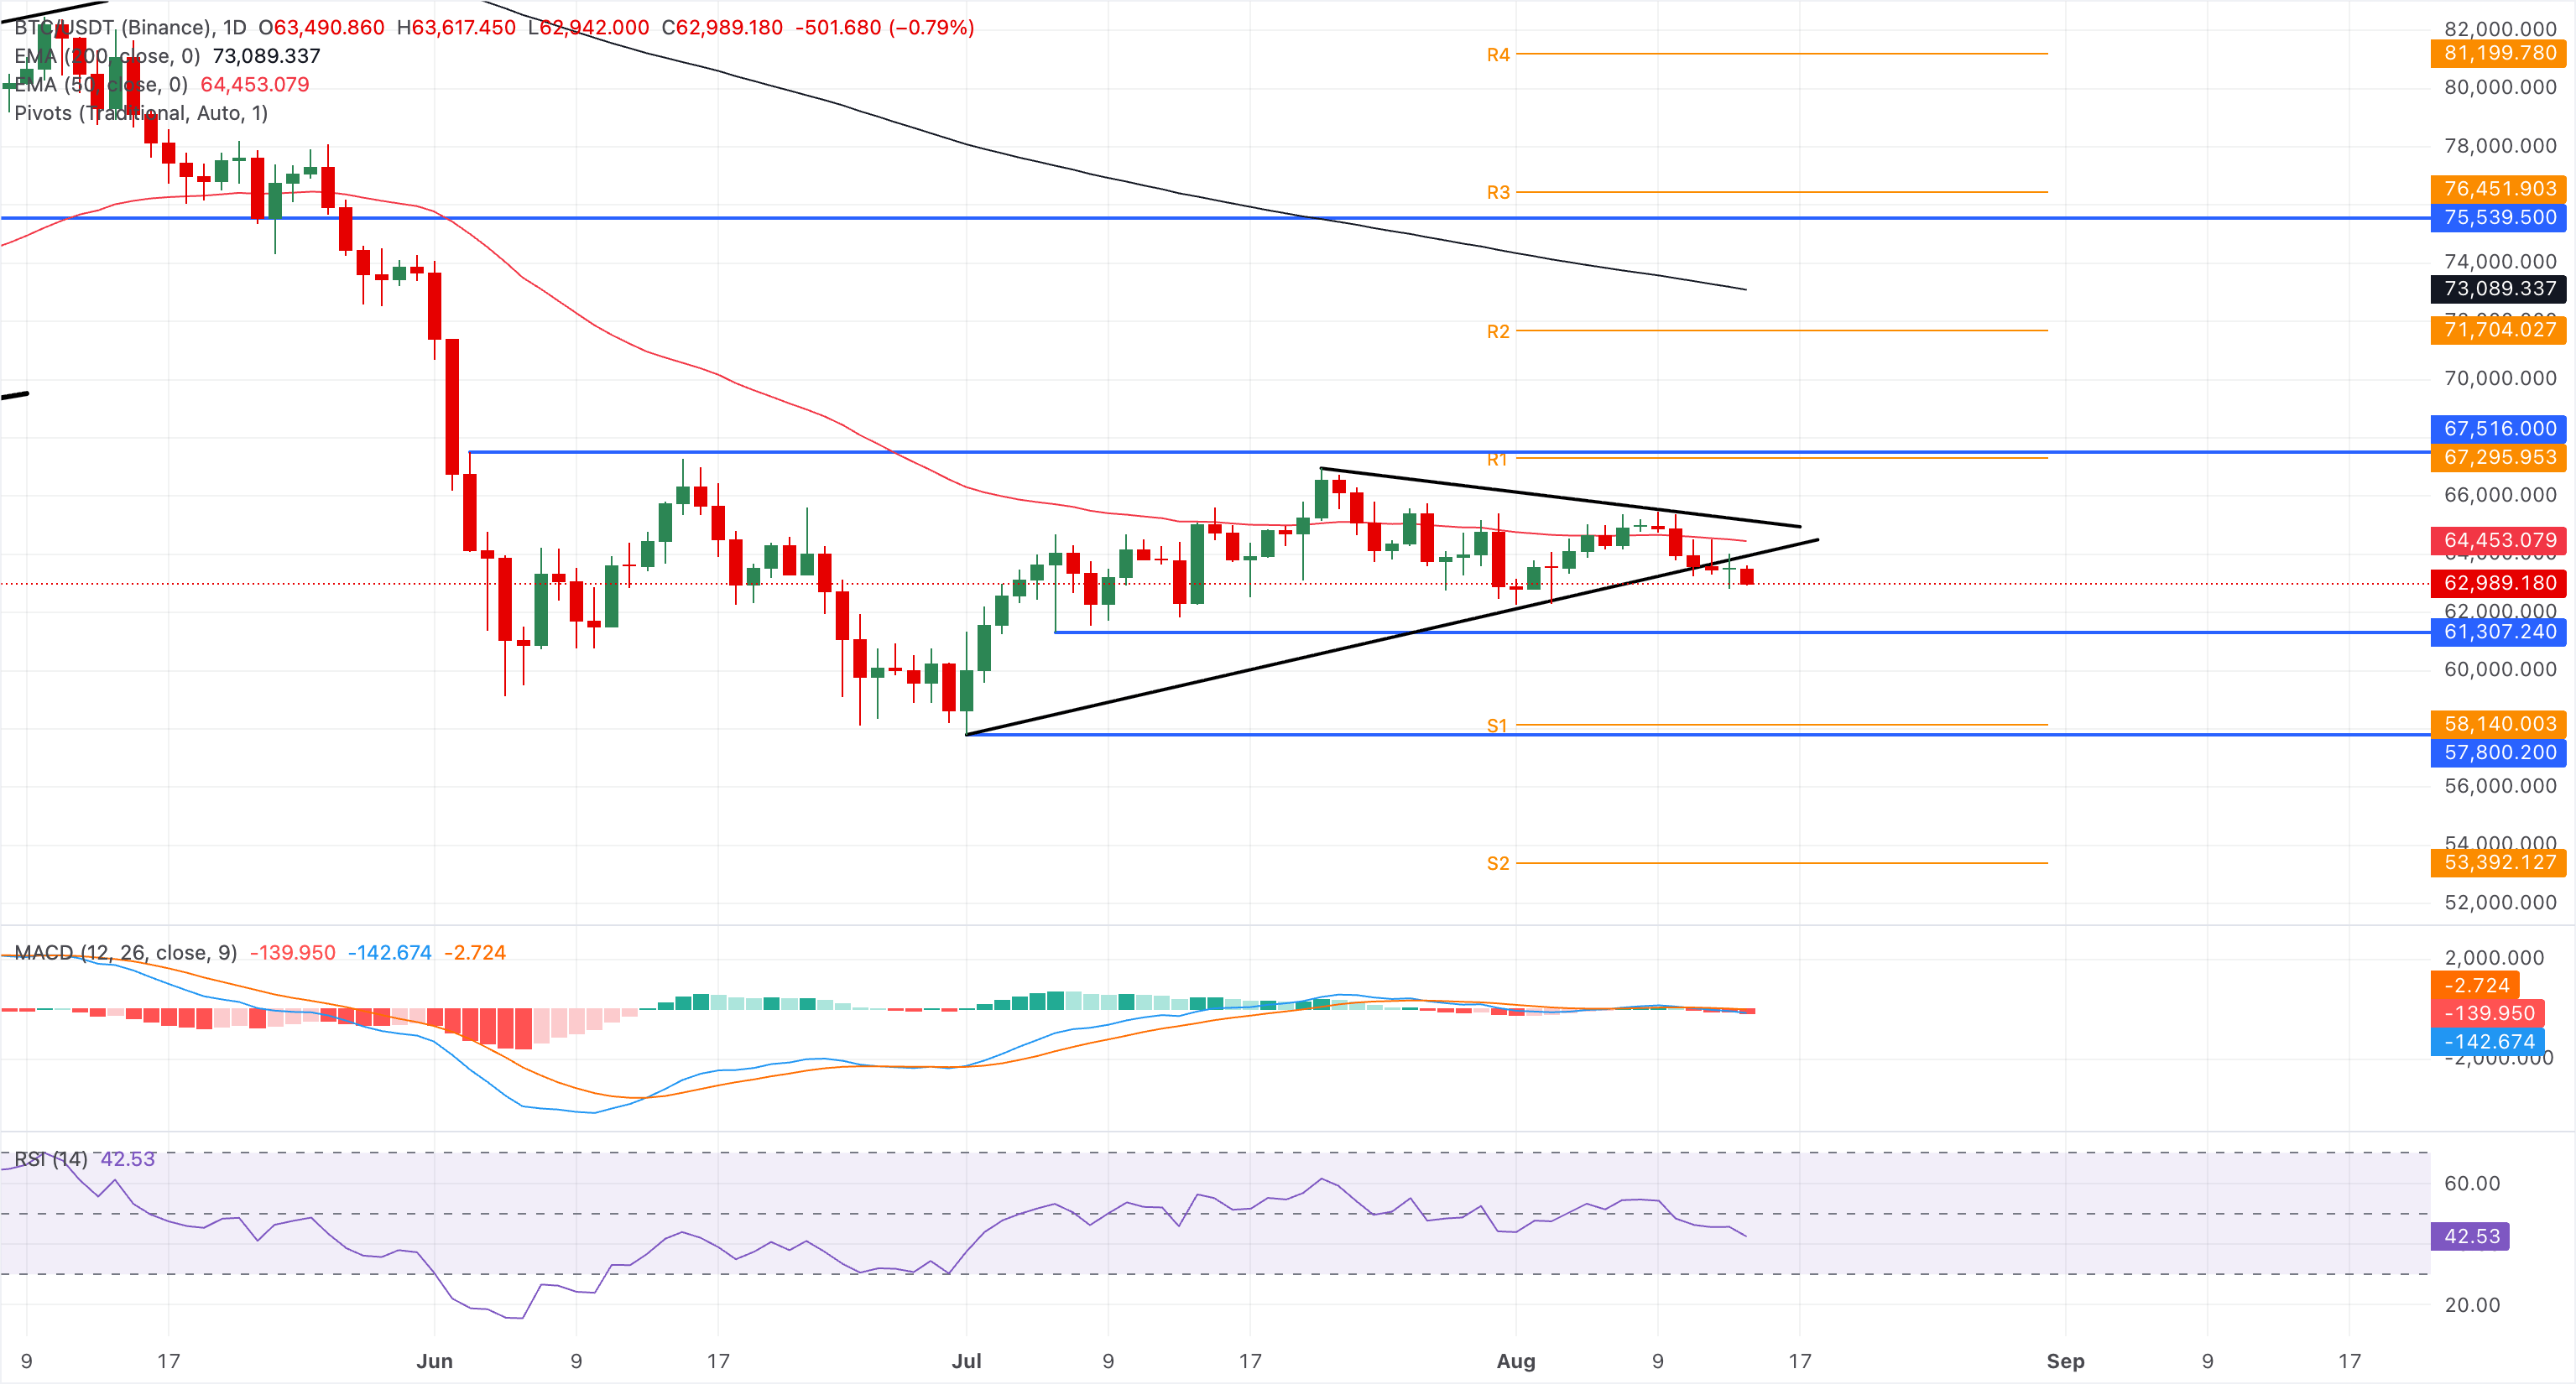
On the upside, a potential rebound in BTC could face resistance at the broken trendline near $63,982, followed by the 50-day EMA at $64,453.
Altcoins technical outlook: Ethereum and XRP risk steeper decline
Ethereum is trading around $1,873, holding marginally above the 50-day EMA at $1,865, with support from a rising trendline near $1,870. In addition, the 23.6% Fibonacci retracement, measured over the recent upswing from $1,512 to $1,981, at $1,870 supports the 50-day EMA.
From a technical perspective, a decisive close below this cluster could trigger a bearish reversal, with the 50% retracement at $1,746 as the next support level.
Momentum is mixed, with the RSI at 49 hovering around the neutral zone, the MACD and signal line in a downtrend, and a steady negative histogram, suggesting neutral-to-bearish pressure.
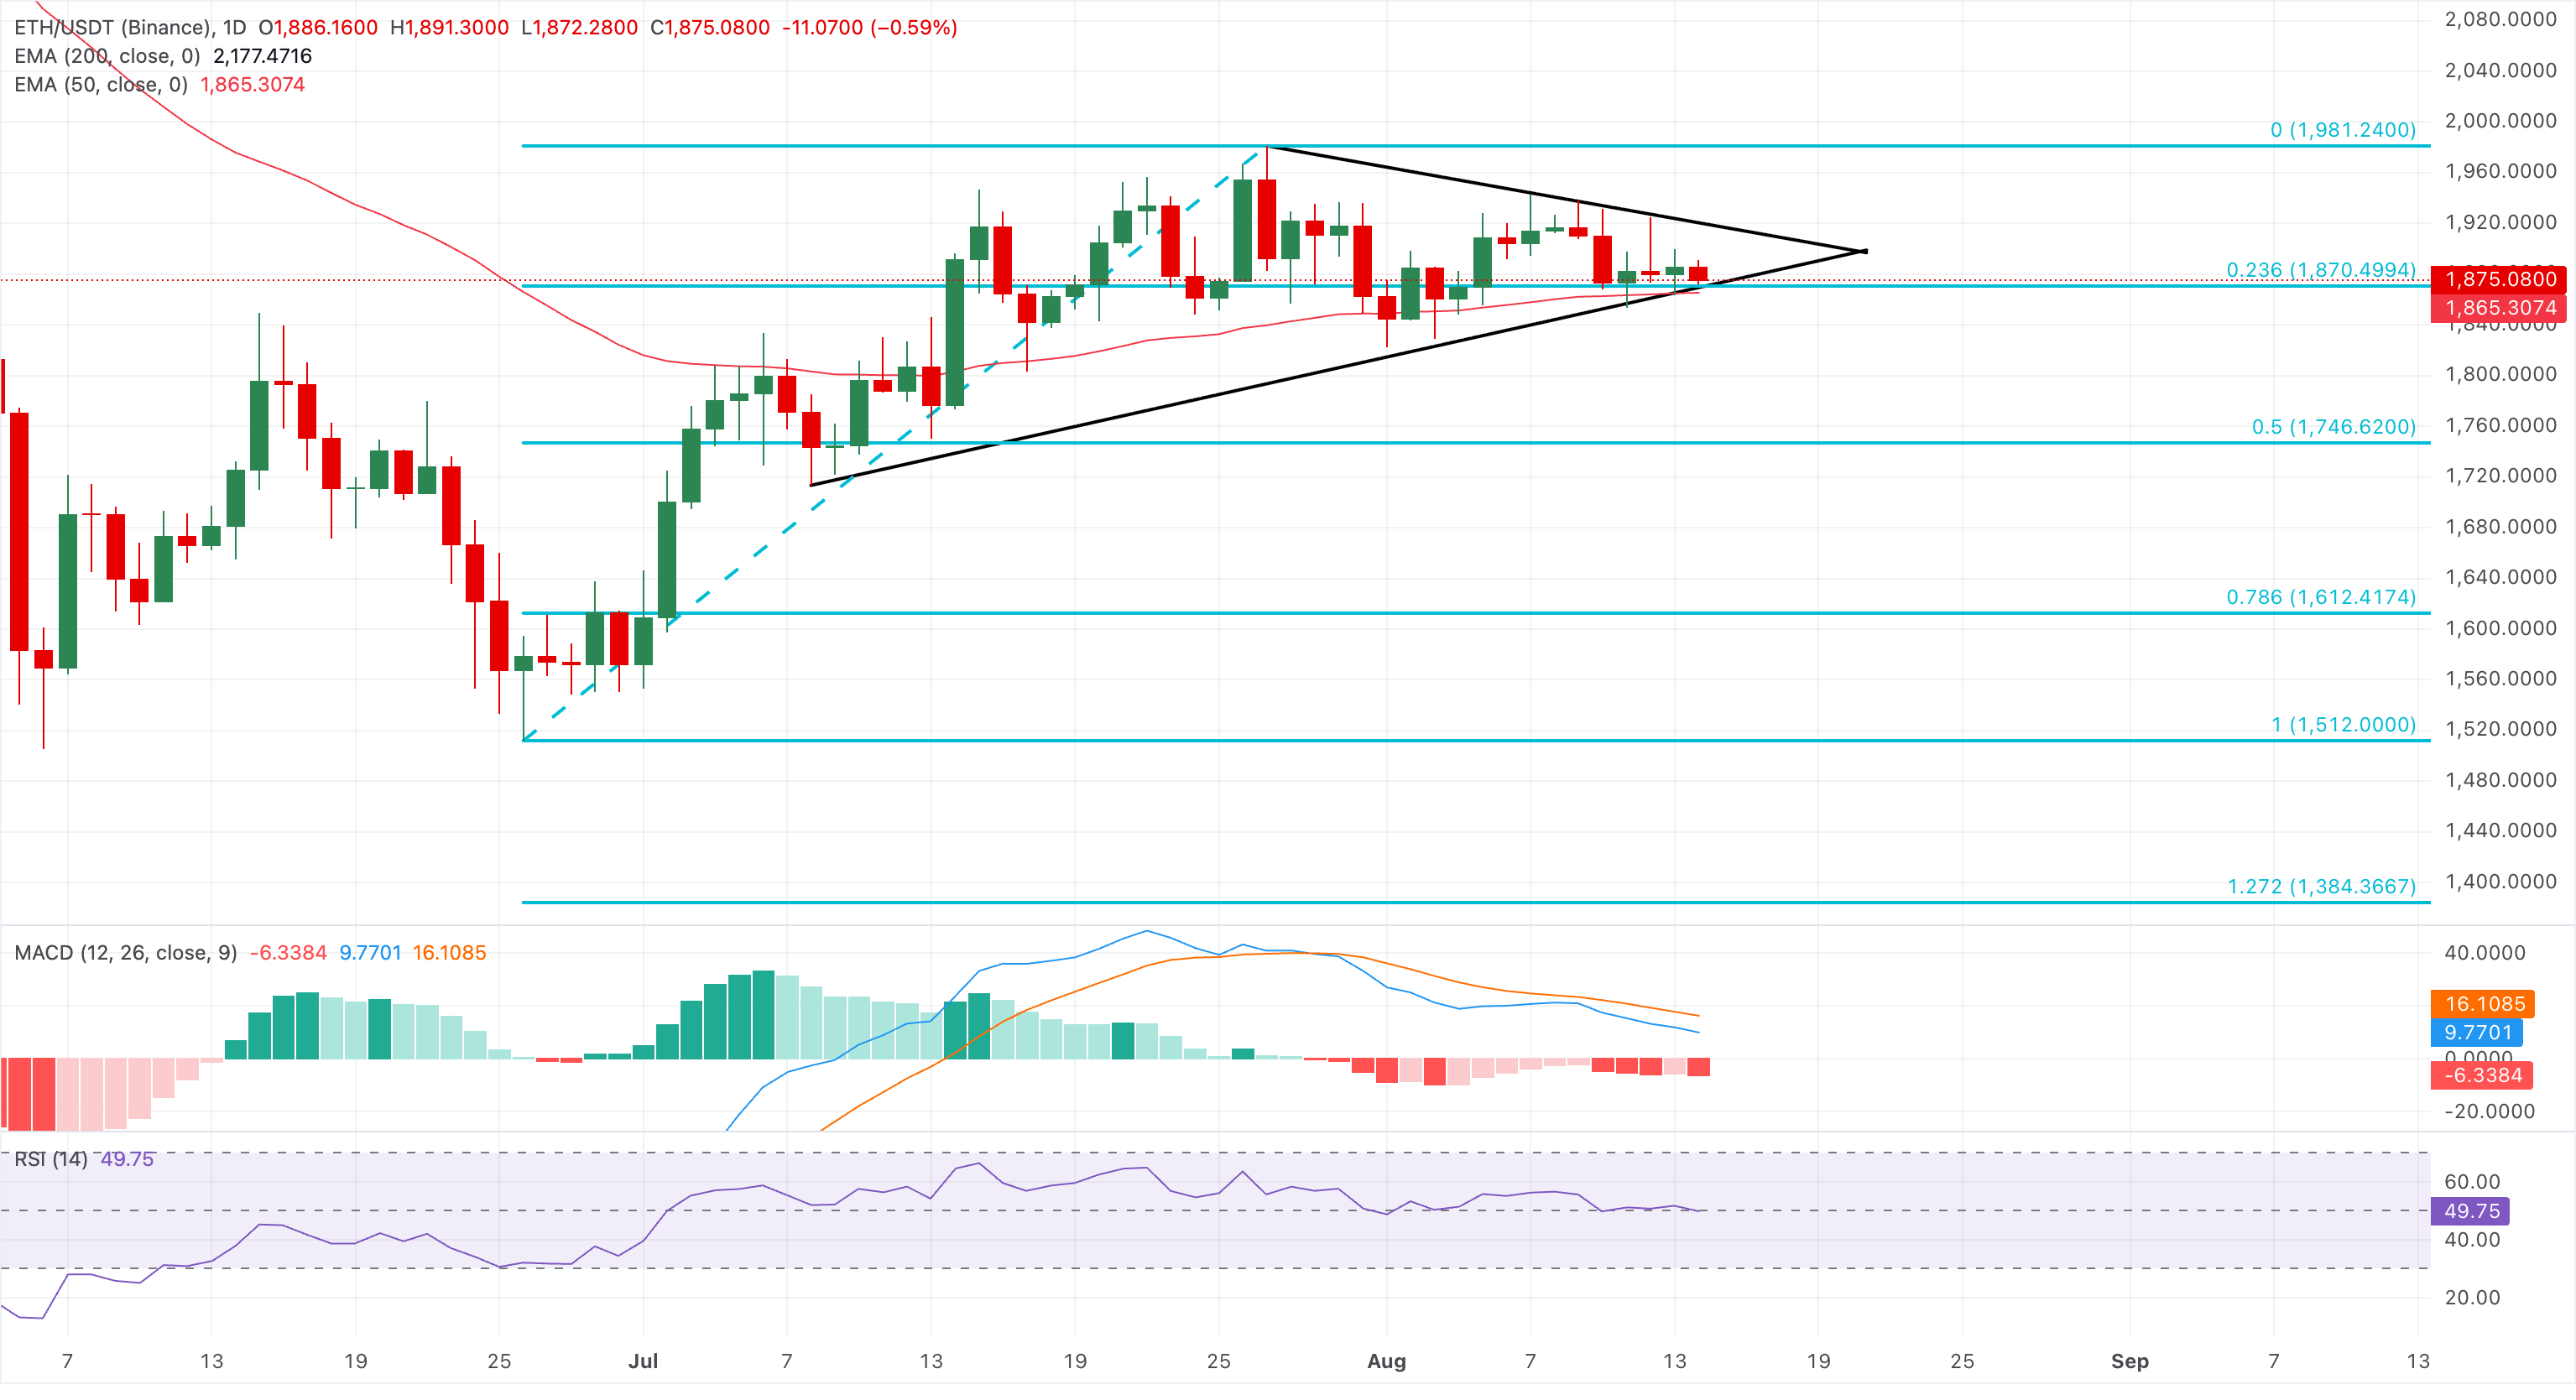
Looking up, a descending trendline near $1,919 guards the way toward the cycle high anchor at $1,981. A sustained break above that broader zone would shift the near-term bias back toward a more decisively bullish stance.
XRP hovers around $1.0075, extending a bearish bias as price holds beneath both the 50-day EMA at $1.0876 and the 200-day EMA at $1.3598. The altcoin has maintained a steady downward trend over the last two weeks, approaching the $1.0000 psychological threshold.
Momentum remains weak, with the RSI near 36, reflecting firm bearish pressure, while the MACD and signal line decline further into negative territory, reaffirming persistent downside pressure.
Looking down, a slippage below the S1 Pivot level at $0.9945, followed by the S2 Pivot level at $0.9271.
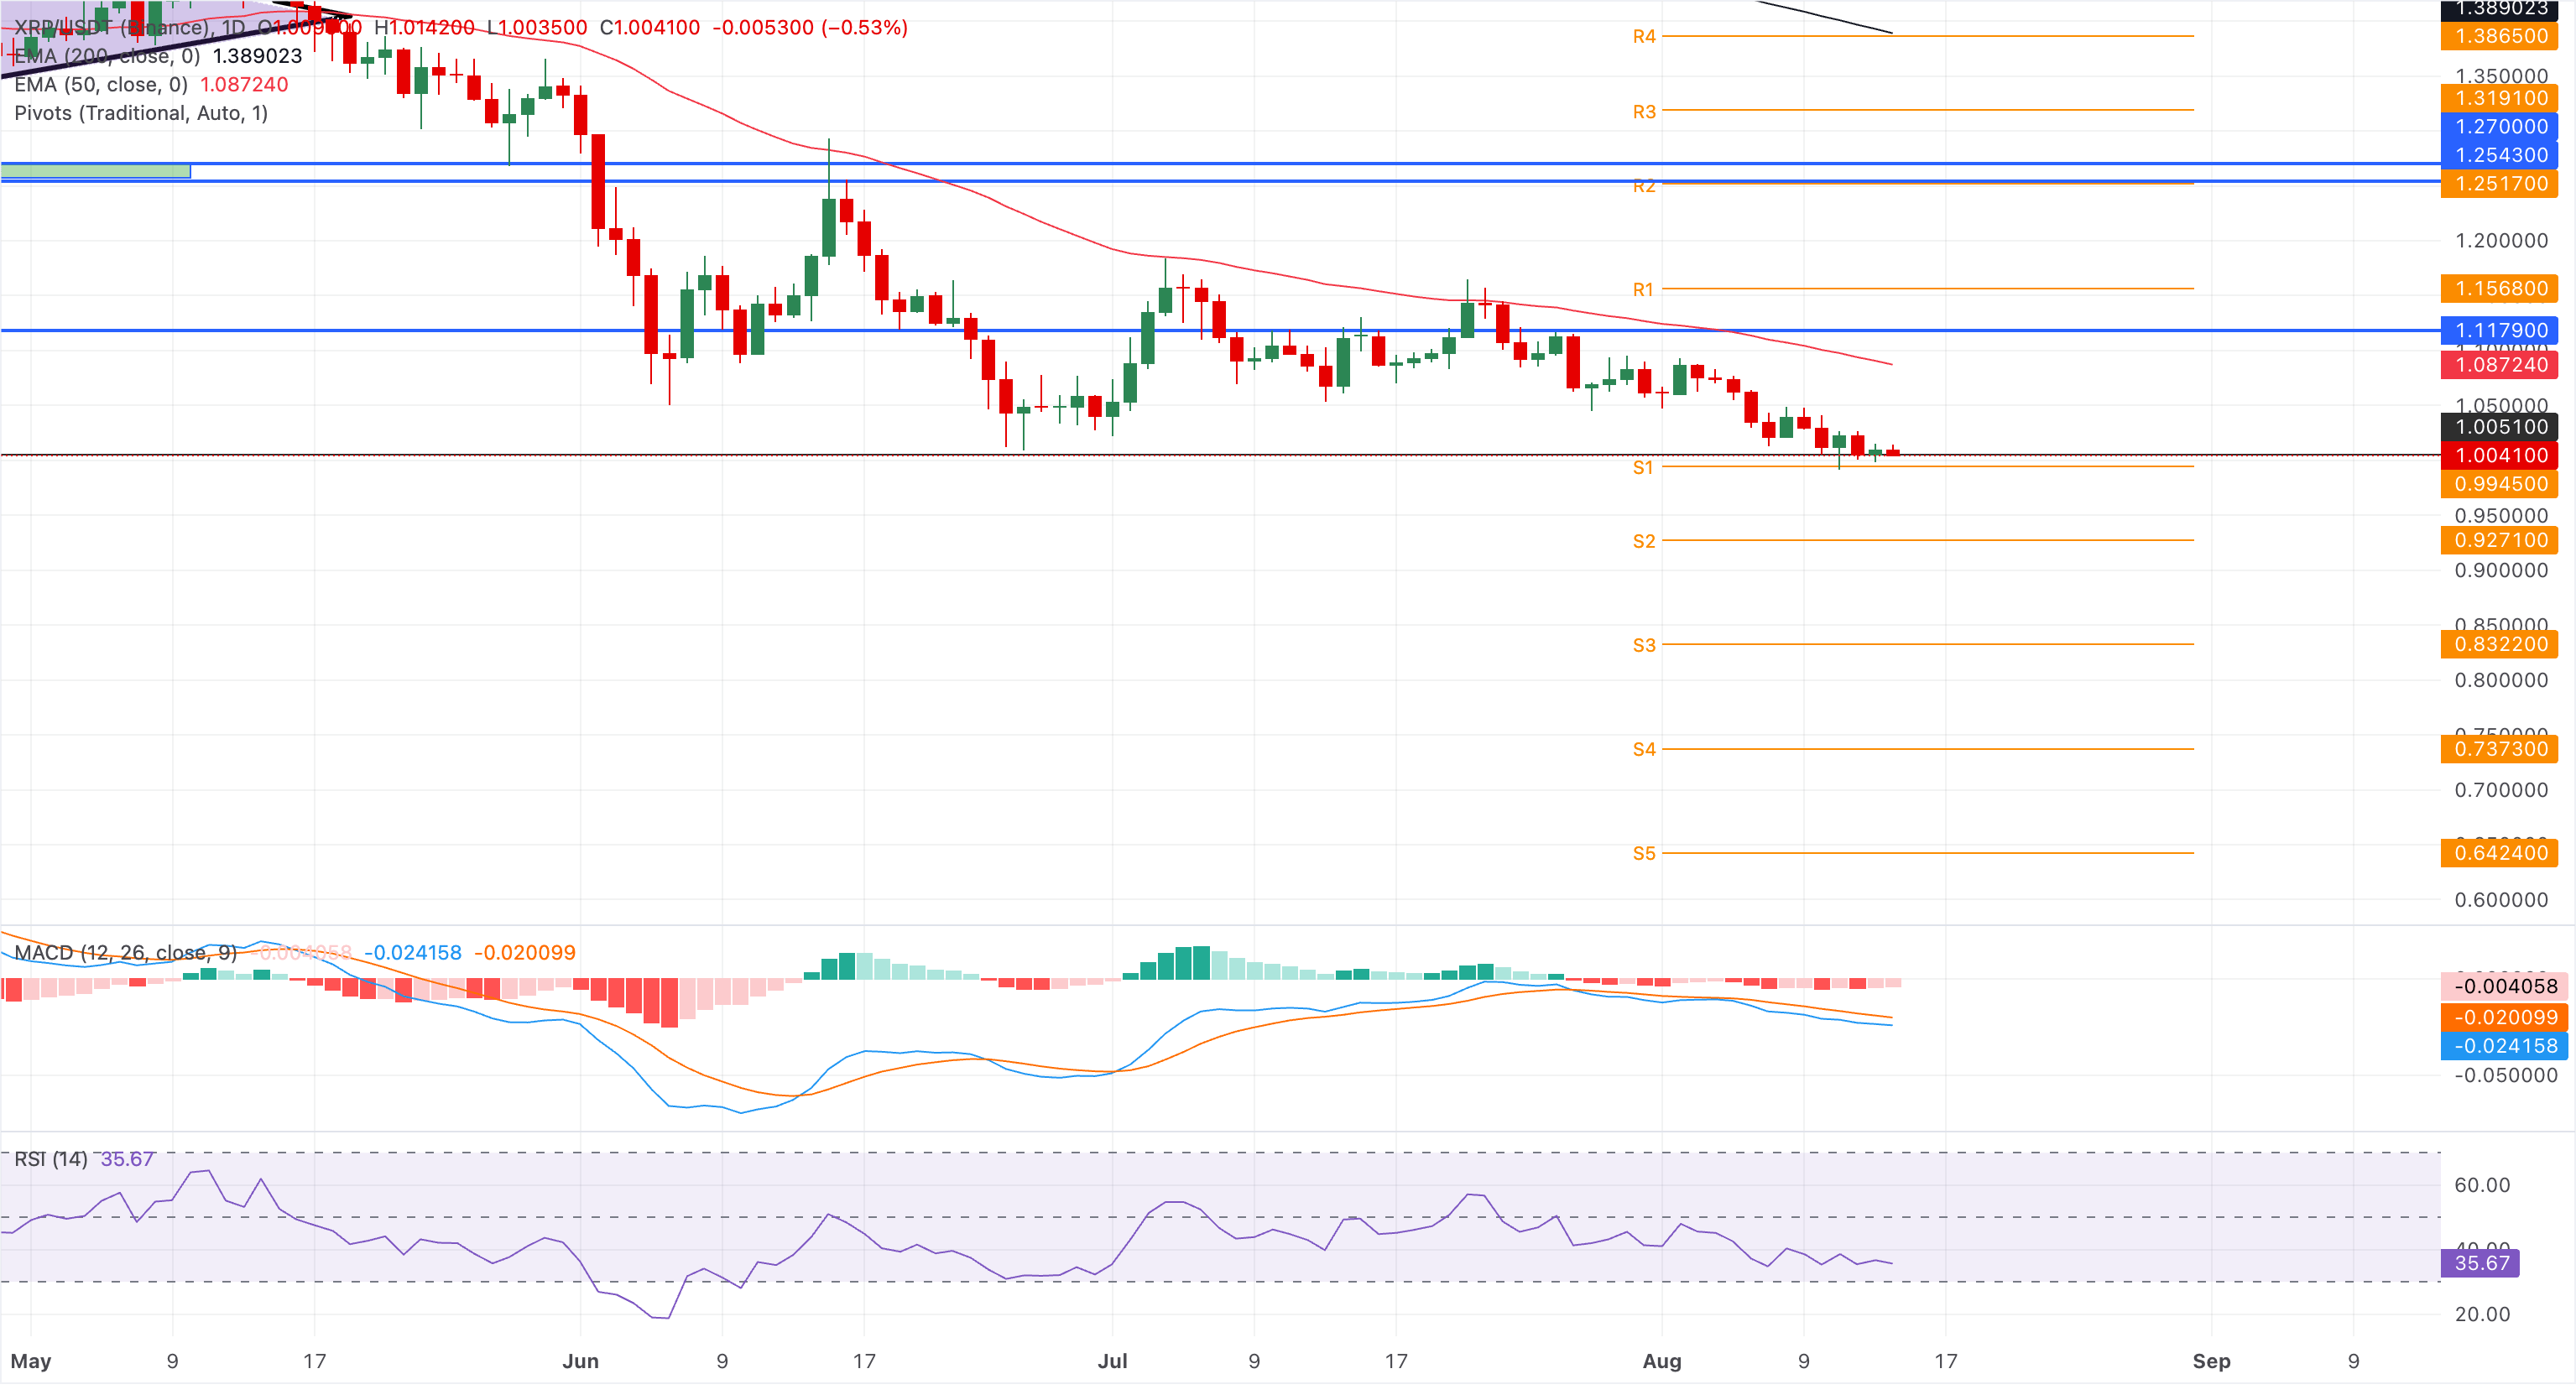
On the topside, initial resistance emerges at the 50-day EMA around $1.0876. A sustained breakout above this short-term moving average could signal a bullish shift.
(The technical analysis of this story was written with the help of an AI tool. Know more.)
Recommended Articles


