


AMD Trades at 63x Forward Earnings, While Nvidia Trades at 24x. History Says This Is the Better Buy.
Key Points
AMD stock has outperformed Nvidia throughout 2026 by a wide margin.
Despite the stock's performance, AMD's business is much smaller and growing more slowly compared to Nvidia.
History suggests a pullback may be in store for one of these chip stocks, while a breakout could be around the corner for the other.
- 10 stocks we like better than Nvidia ›
In the rapidly expanding semiconductor ecosystem, Advanced Micro Devices (NASDAQ: AMD) and Nvidia (NASDAQ: NVDA) stand as pivotal players powering the compute backbone of artificial intelligence (AI). Nvidia dominates with its Blackwell and Rubin GPU architectures, which deliver industry-leading performance for large-scale training and inference workloads.
Meanwhile, AMD contributes complementary technology via its Instinct MI-series accelerators and Epyc processors, offering high-performance CPUs and GPUs that hyperscalers integrate for cost-effective AI clusters.
Missed Nvidia in 2009? This Rare Signal Is Flashing Again. In 2009, a "Double Down" signal flashed for a little-known chipmaker called Nvidia. For the first time in years, that same "Total Conviction" signal is flashing for a company 1/100th the size of Nvidia. Continue »
Hyperscalers such as Microsoft, Amazon, Alphabet, and Meta Platforms rely on both companies extensively -- deploying Nvidia GPUs for AI acceleration while leaning on AMD's CPU and GPU offerings for broader data center efficiency and diversification away from single-supplier risk. Yet when the valuations are examined side by side, only one of these AI chip stocks emerges as the clear buy right now.
Image source: The Motley Fool.
Assessing the valuation discrepancy between Nvidia and AMD
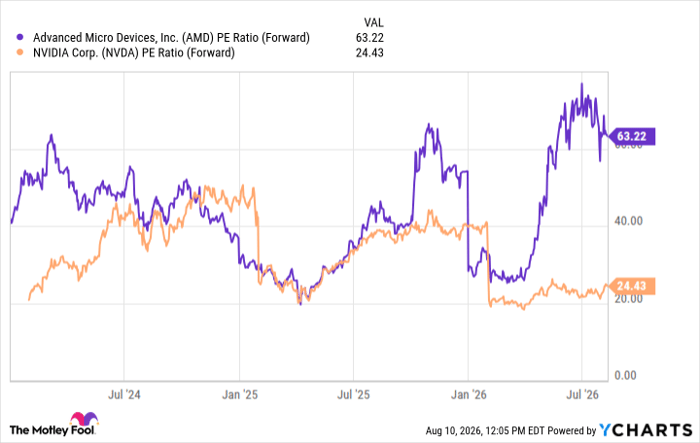
The chart below illustrates the forward price-to-earnings (P/E) ratios for Nvidia and AMD. The trends reveal a striking divergence: AMD currently trades at a forward P/E of 63, while Nvidia sits at 24. Over the displayed time period spanning mid-2024 through today, Nvidia's forward P/E has largely existed in a band between roughly 20x and 40x, whereas AMD's ratio has climbed sharply in more recent months.
Data by YCharts.
AMD's premium appears counterintuitive. Competitive pressures from custom ASICs developed by hyperscalers -- Google's TPUs, Amazon's Trainium and Inferentia chips, and Microsoft's Maia -- appear to be intensifying primarily against Nvidia, whose GPUs face substitution risk as cloud providers seek to lower infrastructure costs and assert greater control over their chip stack.
Therefore, some investors might actually expect Nvidia's valuation multiple to compress aggressively. However, these same dynamics do not apply to AMD, which commands an elevated valuation, while Nvidia's profile has stabilized to a more modest level.
This discrepancy suggests investors are pricing in catch-up potential for AMD's Instinct accelerators and accompanying software stack, even as the ASIC threat remains acute for Nvidia as the incumbent AI chip designer.
Comparing AMD's growth to Nvidia
AMD's second-quarter financial results showed solid but comparatively measured expansion. The company reported total revenue of $11.5 billion, a 50% increase year over year. AMD's data center segment -- the primary AI growth driver -- generated $6.7 billion in sales, surging 107% year over year. Meanwhile, free cash flow grew modestly to $1.6 billion.
Nvidia has yet to report second-quarter results. But during the first quarter, Nvidia showed far greater scale and velocity relative to AMD. Total revenue reached $81.6 billion, up 85% year over year, with record data center revenue of $75.2 billion, climbing 92%. Lastly, Nvidia's free cash flow of $48.5 billion nearly doubled from the prior year.
AMD's absolute numbers remain a fraction of Nvidia's, and its overall growth rate lags its larger rival. Despite this slower trajectory and substantially smaller revenue base, AMD's valuation sits at 2.5 times Nvidia's, a valuation gap that seems difficult to justify based on growth and profitability metrics alone.
AMD vs. Nvidia: Which is the better stock to buy?
The trends explored above illustrate a recurring pattern in which both Nvidia and AMD tend to rerate once their forward P/E ratios approach an elevated threshold. In prior cycles, AMD's forward P/E spiked above 50 or 60 only to experience subsequent normalization through multiples compression.
Nvidia has shown similar behavior, with its multiple rising and then settling into more sustainable ranges (which is happening right now). AMD's current levels position the stock for potential normalization in the near term, while Nvidia's relatively modest multiple leaves room for valuation expansion if its growth momentum persists.
History suggests AMD shares could face selling pressure as its premium unwinds, even as Nvidia could accelerate into a new leg higher. Given Nvidia's superior scale, faster overall growth, significantly higher profitability, and more entrenched position in hyperscale AI ecosystems, I think the risk-reward balance favors investing in Nvidia at the moment. Investors seeking exposure to the ongoing AI semiconductor boom might be better served by buying Nvidia stock over AMD right now while the valuation gap remains this wide.
Should you buy stock in Nvidia right now?
Before you buy stock in Nvidia, consider this:
The Motley Fool Stock Advisor analyst team just identified what they believe are the 10 best stocks for investors to buy now… and Nvidia wasn’t one of them. The 10 stocks that made the cut could produce monster returns in the coming years.
Consider when Netflix made this list on December 17, 2004... if you invested $1,000 at the time of our recommendation, you’d have $411,427!* Or when Nvidia made this list on April 15, 2005... if you invested $1,000 at the time of our recommendation, you’d have $1,335,252!*
Now, it’s worth noting Stock Advisor’s total average return is 965% — a market-crushing outperformance compared to 215% for the S&P 500. Don't miss the latest top 10 list, available with Stock Advisor, and join an investing community built by individual investors for individual investors.
See the 10 stocks »
*Stock Advisor returns as of August 12, 2026.
Adam Spatacco has positions in Alphabet, Amazon, Microsoft, and Nvidia. The Motley Fool has positions in and recommends Advanced Micro Devices, Alphabet, Amazon, Meta Platforms, Microsoft, and Nvidia. The Motley Fool has a disclosure policy.
Recommended Articles


