

GBP/USD Price Forecast: Rally pauses near 1.3300
- GBP/USD retraces to near 1.3230 from an over six-month high of 1.3300.
- Positive development on US-Japan trade talks has offered some relief to the US Dollar.
- Soft UK inflation data has paved the way for BoE interest rate cuts.
The GBP/USD pair ticks lower to near 1.3230 during European trading hours on Thursday. The Cable edges lower as the US Dollar (USD) attracts some bids on meaningful progress in trade talks between the United States (US) and Japan.
The US Dollar Index (DXY), which tracks the Greenback’s value against six major currencies rebounds to near 99.50 from the three-year low of 99.00.
Investors see this as a sign that heightened global economic uncertainty, driven by imposition of hefty tariffs by US President Donald Trump, will ease amid growing confidence that Trump is leaned towards having bilateral deals that advancing a trade war will all nations.
Meanwhile, the Pound Sterling (GBP) is still outperforming its other peers even though soft inflation data and grim labor market outlook have paved the way for monetary policy easing by the Bank of England (BoE). Inflation in the UK services sector, which is closely tracked by BoE officials, decelerated to 4.7% in March from 5% in February. UK employers are expected to offer less employment opportunities to offset the impact of increased contribution to social security schemes.
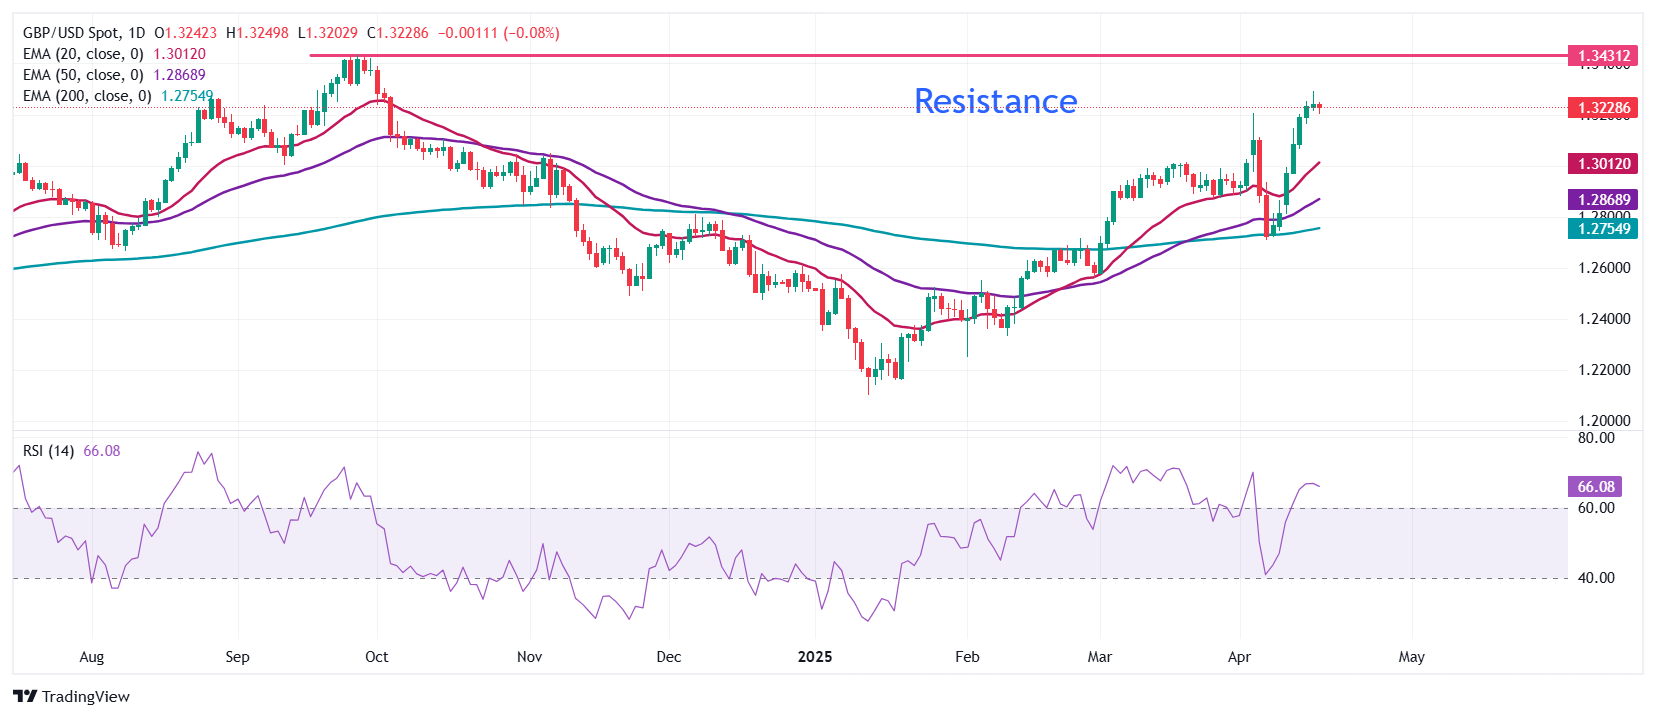
The Pound Sterling struggles to extend its winning streak against the US Dollar for the eighth trading day on Thursday and ticks lower to near 1.3230. However, the near-term outlook of the pair is upbeat as all short-to-long Exponential Moving Averages (EMAs) are sloping higher.
The 14-day Relative Strength Index (RSI) has shown a V-shape recovery from 40.00 to near 70.00, suggesting a strong bullish momentum.
A fresh upside move would appear if the pair will break above the April 16 high of 1.3292. Such a move will drive the major towards the September 25 high of 1.3430, followed by the round-level of 1.3500.
On the flip side, a downside move by the pair below the April 15 low of 1.3164 will take it to near the April 14 low of 1.3063 and the psychological level of 1.3000.
GBP/USD daily chart
Pound Sterling FAQs
The Pound Sterling (GBP) is the oldest currency in the world (886 AD) and the official currency of the United Kingdom. It is the fourth most traded unit for foreign exchange (FX) in the world, accounting for 12% of all transactions, averaging $630 billion a day, according to 2022 data. Its key trading pairs are GBP/USD, also known as ‘Cable’, which accounts for 11% of FX, GBP/JPY, or the ‘Dragon’ as it is known by traders (3%), and EUR/GBP (2%). The Pound Sterling is issued by the Bank of England (BoE).
The single most important factor influencing the value of the Pound Sterling is monetary policy decided by the Bank of England. The BoE bases its decisions on whether it has achieved its primary goal of “price stability” – a steady inflation rate of around 2%. Its primary tool for achieving this is the adjustment of interest rates. When inflation is too high, the BoE will try to rein it in by raising interest rates, making it more expensive for people and businesses to access credit. This is generally positive for GBP, as higher interest rates make the UK a more attractive place for global investors to park their money. When inflation falls too low it is a sign economic growth is slowing. In this scenario, the BoE will consider lowering interest rates to cheapen credit so businesses will borrow more to invest in growth-generating projects.
Data releases gauge the health of the economy and can impact the value of the Pound Sterling. Indicators such as GDP, Manufacturing and Services PMIs, and employment can all influence the direction of the GBP. A strong economy is good for Sterling. Not only does it attract more foreign investment but it may encourage the BoE to put up interest rates, which will directly strengthen GBP. Otherwise, if economic data is weak, the Pound Sterling is likely to fall.
Another significant data release for the Pound Sterling is the Trade Balance. This indicator measures the difference between what a country earns from its exports and what it spends on imports over a given period. If a country produces highly sought-after exports, its currency will benefit purely from the extra demand created from foreign buyers seeking to purchase these goods. Therefore, a positive net Trade Balance strengthens a currency and vice versa for a negative balance.
Recommended Articles


