


Dogecoin Price Forecast: Bearish sentiment and technicals point to deeper correction risk
- Dogecoin remains under pressure on Tuesday, after a correction of over 4% the previous day.
- Declining social dominance, negative funding rates, and rising short positions highlight weakening market sentiment.
- The technical outlook suggests deeper correction if DOGE breaks below the $0.070 psychological support level.
Dogecoin (DOGE) remains under pressure, trading below $0.071 on Tuesday, having fallen over 4% in the previous day. The leading meme coin continues to face mounting selling pressure as social dominance fades, funding rates remain negative, and bearish traders increase their short positions. With momentum indicators weakening, a daily close below the key $0.070 psychological support could pave the way for deeper correction.
On-chain and derivatives metrics show bearish bias
Santiment’s Social Dominance metric for DOGE supports a bearish outlook. The index measures the share of DOGE-related discussions across the cryptocurrency media. It has been in a downtrend since last week, with a reading of 0.06% on Tuesday. This fall indicates fading market interest and sentiment among the meme coin investors.
 [09-1785215493554.27.16, 28 Jul, 2026].png)
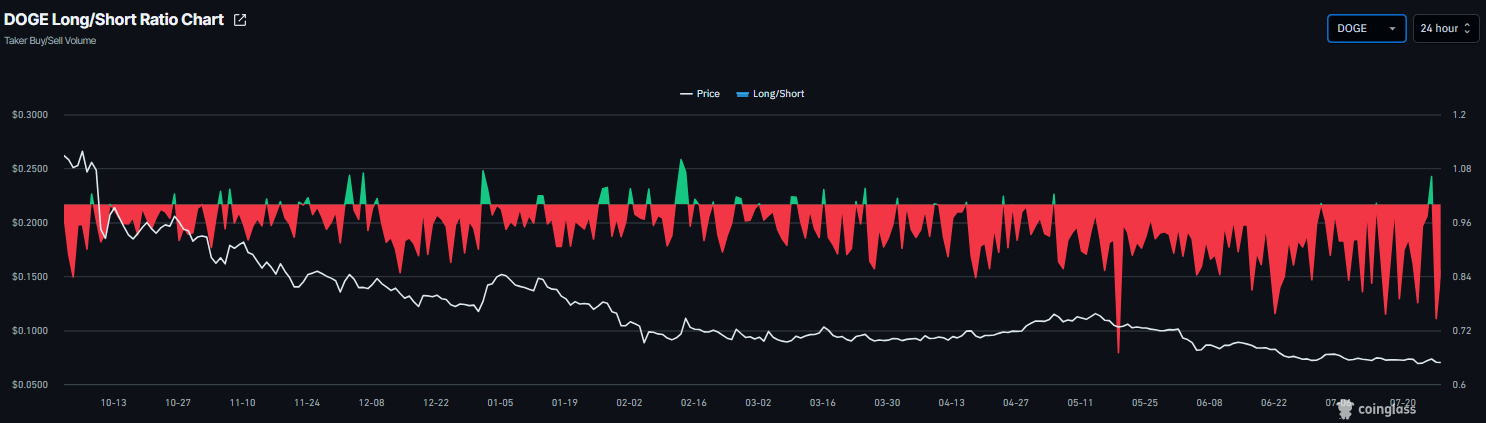
On the derivatives side, metrics show weakening conditions. CoinGlass’ long-to-short ratio for the dog-themed meme coin read 0.74 on Tuesday, nearing its lowest levels in over a month. The ratio being below one, indicates bearish sentiment, as traders are betting the asset's price will fall.
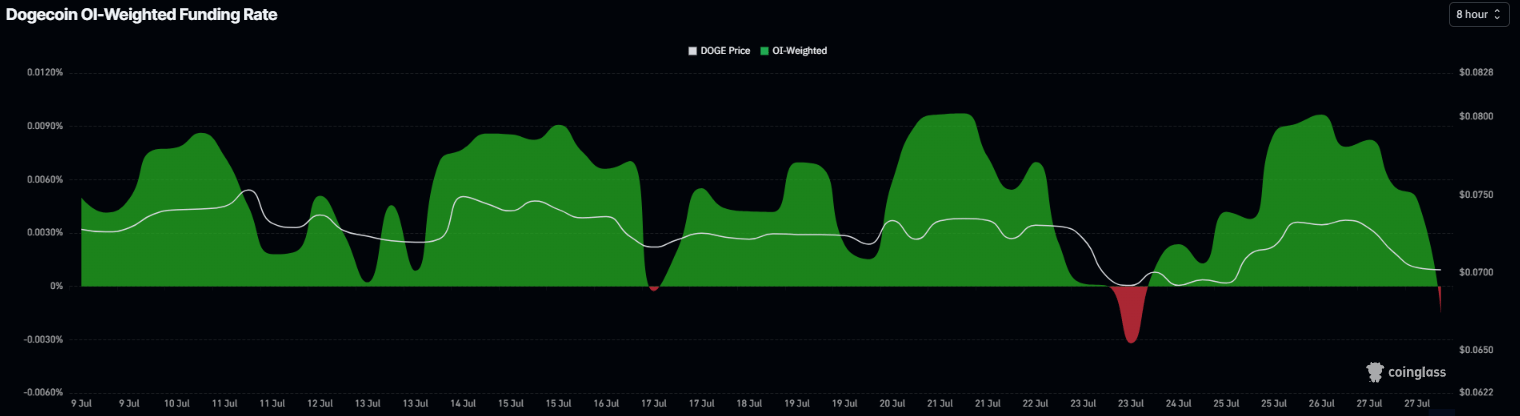
In addition, the funding rates show a bearish outlook. DOGE funding rates flipped negative on Tuesday, reading -0.0015%, indicating that shorts are paying longs and signaling bearish sentiment.
Dogecoin technical outlook: DOGE could extend losses if it closes below $0.070
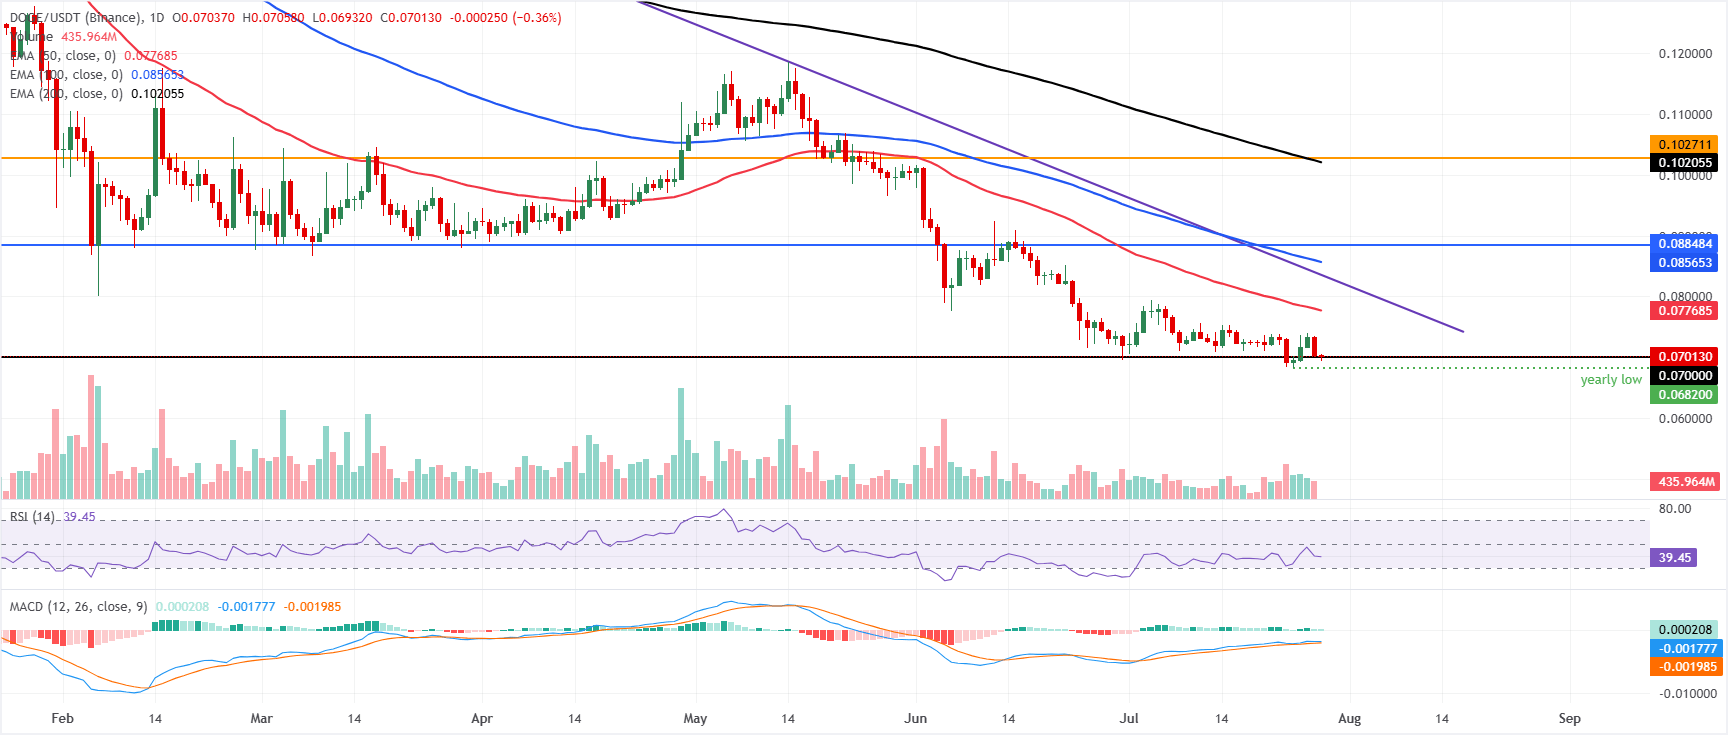
Dogecoin trades at $0.0701 on Tuesday, extending its near-term bearish bias and remaining well below the 50-day, 100-day, and 200-day Exponential Moving Averages (EMAs).
DOGE is clinging just above the horizontal support at $0.070. Still, subdued momentum persists, with the Relative Strength Index (RSI) hovering below the neutral 50 line and the Moving Average Convergence Divergence (MACD) only marginally positive, suggesting that any rebound attempts could remain limited while the structure remains capped overhead.
On the topside, initial resistance is aligned with the 50-day EMA near $0.077, followed by the descending trendline barrier around $0.083 and the 100-day EMA at $0.085. Further up, a horizontal cap at $0.088 precedes a heavier supply zone defined by the 200-day EMA at $0.102.
On the downside, a clear break below the immediate floor at $0.0700 would open the door to fresh lows, reinforcing the prevailing bearish tone.
(The technical analysis of this story was written with the help of an AI tool. Know more.)
Recommended Articles


